Uncategorized files
Jump to navigation
Jump to search
Showing below up to 50 results in range #51 to #100.
-
-
-
-
-

-
-
-
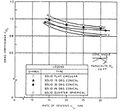
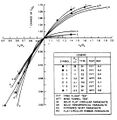
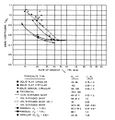
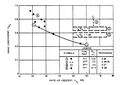
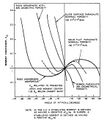
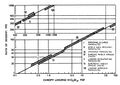
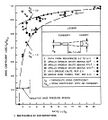 FIGURE 5-21. Parachute Drag Loss Caused by Forebody Wake..jpg 480 × 534; 47 KB
-
-
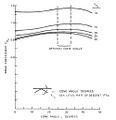
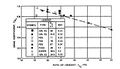
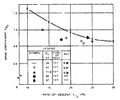
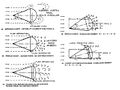
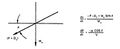
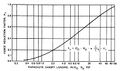
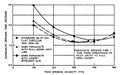
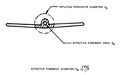 FIGURE 5-23. Determination of Effective Forebody Diameter..jpg 472 × 295; 14 KB
-
-
-
-
-
-
-
-
-
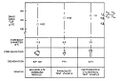
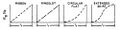
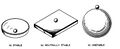 FIGURE 5-30. Illustration of Static Stability..jpg 763 × 311; 30 KB
-
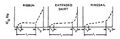
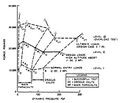
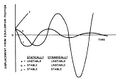 FIGURE 5-31. Graphical Illustration of Dynamic Stability..jpg 673 × 446; 31 KB
-
-
-
-
-
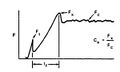
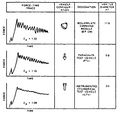
 FIGURE 5-36. Parachute Canopy Inflation Process..jpg 611 × 409; 36 KB
-
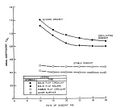
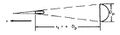 FIGURE 5-37. Filling Distance of a Parachute Canopy..jpg 363 × 107; 7 KB
-
-
-
-
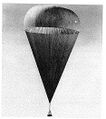
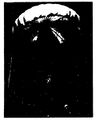
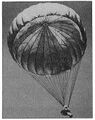
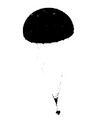
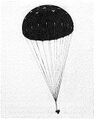 FIGURE 5-4. Twenty-Four-Foot-Diameter Hemispherical Parachute.2.jpg 522 × 651; 134 KB
-
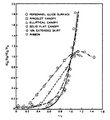 FIGURE 5-40. Drag-Area Ratio Versus Dimensionless Filling Time..jpg 367 × 401; 24 KB
-
-
-
-
-
-
-
-
-
-
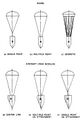
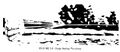 FIGURE 5-5. Guide Surface Parachute..jpg 616 × 266; 31 KB
-
 FIGURE 5-5. Guide Surface Parachute.2.jpg 1,002 × 371; 180 KB
-
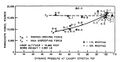
 FIGURE 5-50. Opening-Force Factor Versus Mass Ratio..jpg 656 × 696; 111 KB
-
-
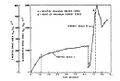
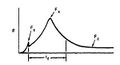
 FIGURE 5-52. Drag-Area Profile for Parachute Inflation Sequence..jpg 624 × 523; 44 KB
-
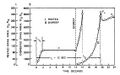
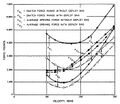
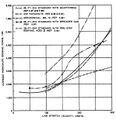 FIGURE 5-53. Opening Forces of Various Personnel Parachutes..jpg 596 × 619; 62 KB
-
-
-
-


..jpg)
..jpg)


.jpg)


