Parachute Performance
PARACHUTE CHARACTERISTICS AND PERFORMANCE
Parachutes are the building blocks of any parachute recovery system. Their performance characteristics must be known and considered in selecting and designing a system. In the early 1920s, the circular, flat parachute manufactured from solid cloth was the primary parachute used for the rescue of aviators, for sport jumping, and for airdrop of light loads. In the 1930s, the military began using parachutes for the airdrop of troops and cargo and for the landing deceleration of aircraft. Beginning in the 1940s, parachutes were used for recovery of unmanned aircraft, missiles, ordnance devices, and, later, recovery of manned and unmanned spacecraft.
These new parachute applications resulted in, or were the result of, the development of numerous new types of parachutes. The new parachutes were superior to the circular, flat, solid textile parachutes in stability, opening forces, and drag. Some of the new types could be used for supersonic applications and others for descent in a gliding mode. However, the superior performance characteristics were not combined in one parachute. Prudent analysis, therefore, is a requisite for matching the appropriate parachute to the desired application.
5.1 PARACHUTE DECELERATOR TYPES
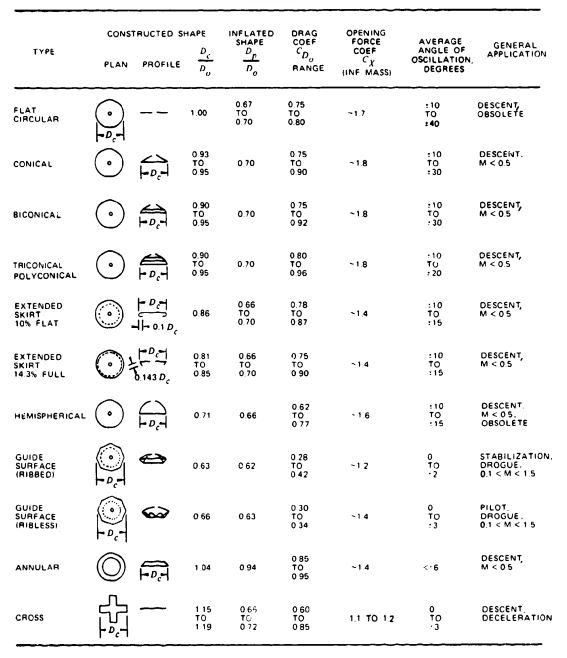
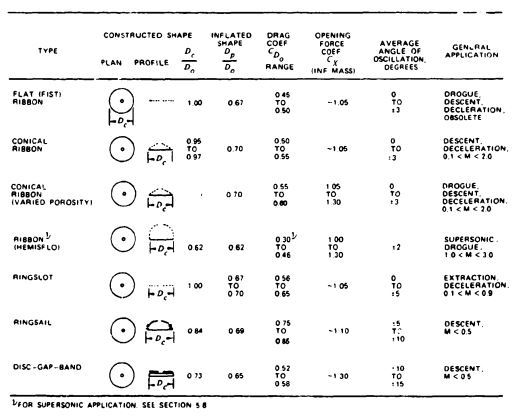
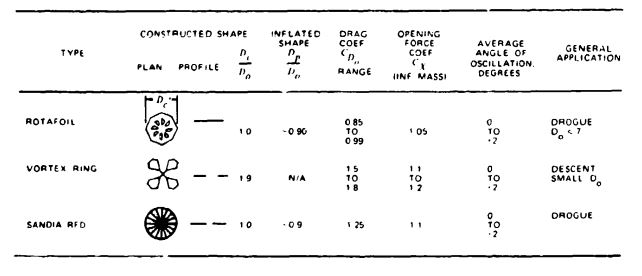
Common parachute types, varying in stability, drag, opening behavior, velocity capability, and other design and performance characteristics, are listed in Tables 5-1 through 5-5, which are updated from the tables in Reference 2.1. The performance data are to be used for preliminary considerations only. Detailed performance data are found in sections 5.2 through 5.10 and in the references (section 5.12). The following comments refer to the column headings in Tables 5-1 through 5-5.
Constructed Shape. The Plan and Profile columns define the constructed diameter and the cross section of the parachute canopy.
, the constructed diameter of the canopy, can be obtained from the drawing of the specific parachute.
Nominal Diameter. Do, the nominal diameter of the parachute, can be calculated from the total canopy surface area, So, including the area of the vent and all other openings:
Inflated Shape. , the projected diameter of the inflated parachute canopy, is best calculated from the projected or inflated canopy area, , as measured in wind-tunnel tests. The projected diameter of a parachute varies with parachute type, canopy porosity, suspension-line length, velocity, and canopy design. A large projected diameter, , will generally result in a large drag coefficient, . The ratio of projected diameter to nominal diameter, , is an indication of the drag effectiveness of the parachute design, the larger the projected diameter in relation to the nominal diameter, the larger the drag coefficient.
Drag Coefficient. is the drag coefficient related to the total canopy surface area, . The drag coefficient indicates how effectively a parachute canopy produces drag with a minimum of cloth area, thereby minimizing weight and volume.
Opening-Force Coefficient. , the opening-force coefficient, indicates the difference between the instantaneous opening force and the steady drag force at constant speed. This condition, called the infinite mass case, is obtained in wind-tunnel tests and in parachute applications with high canopy loadings, , as exemplified by aircraft deceleration parachutes and first-stage drogue chutes.
Average Angle of Oscillation. The angle of oscillation is measured in wind-tunnel tests or during free-flight tests. Oscillation on most solid textile parachutes varies with size and descent velocity. Large parachutes oscillate less than small parachutes. Unstable parachutes tend to descend in an oscillating mode at rates of descent in excess of 25 ft/s, glide at descent rates below 15 ft/s, and mix glide and oscillation during medium rates of descent.
General Application. The general application column in Tables 5-1 through 5-5 indicates the primary use of the particular parachute type.
, in Table 5-4 is the wetted upper canopy surface area on gliding parachutes.
in Table 5-4 is the ratio of the upper surface area to total cloth area, including all ribs and stabilizer panels.
Referenced reports for most of the listed parachutes will be found in subsequent sections of Chapter 5, but primarily in section 5.2, Parachute Drag and Wake Effects.
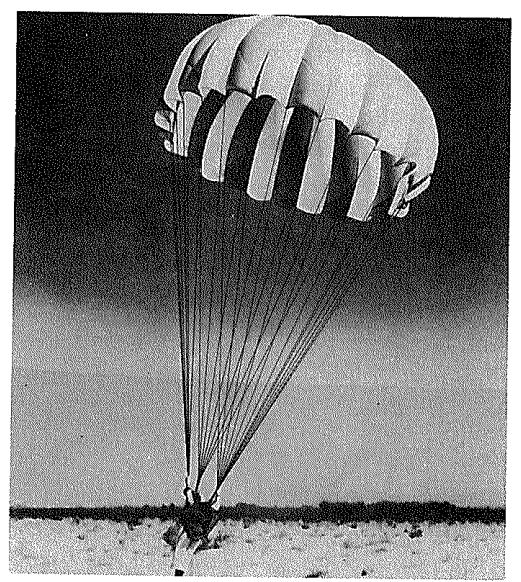
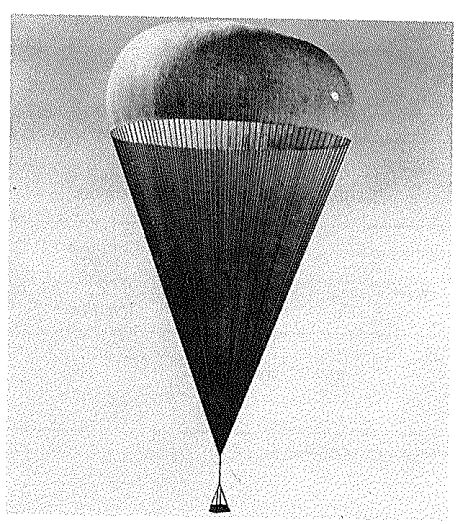
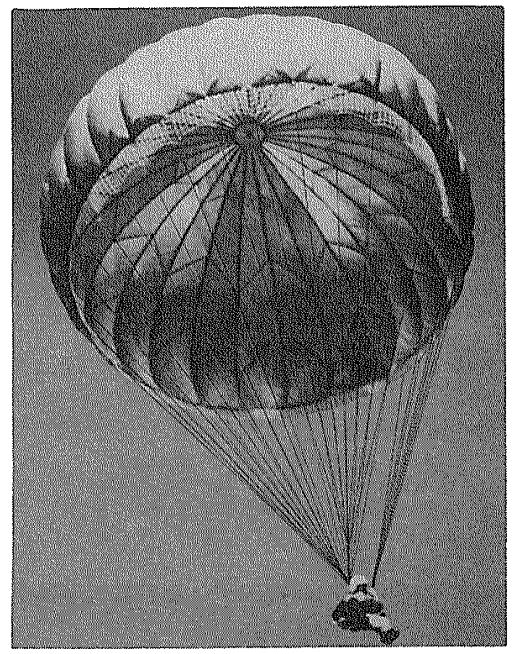
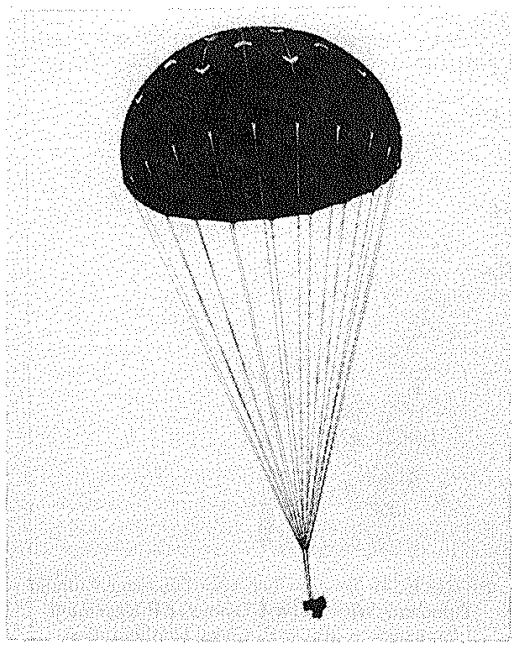
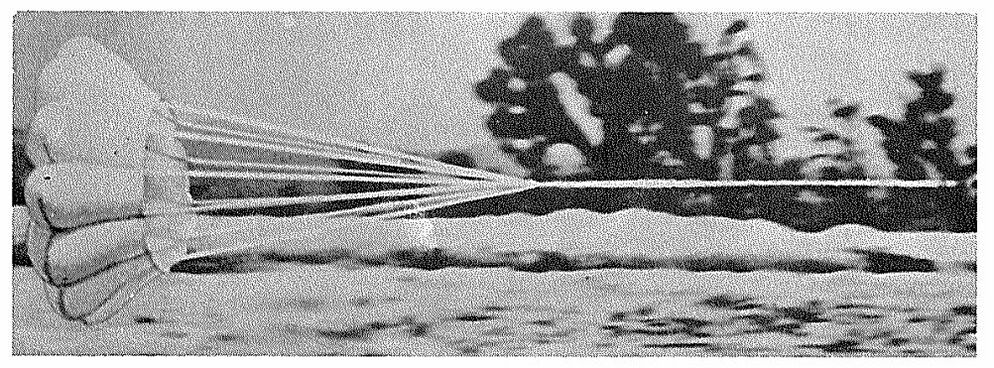
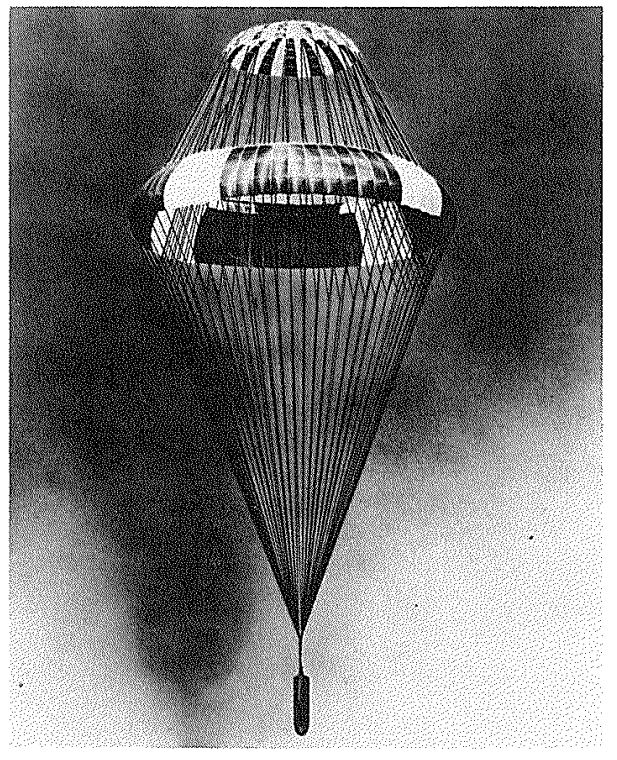
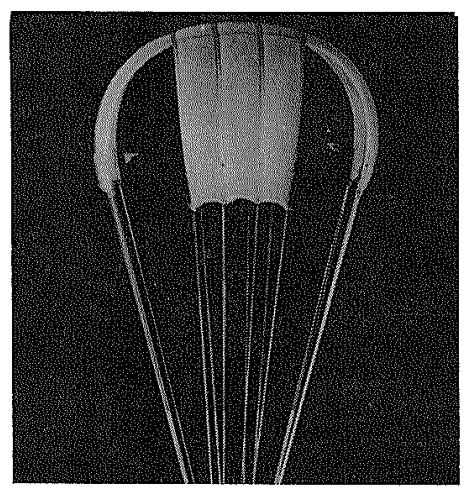
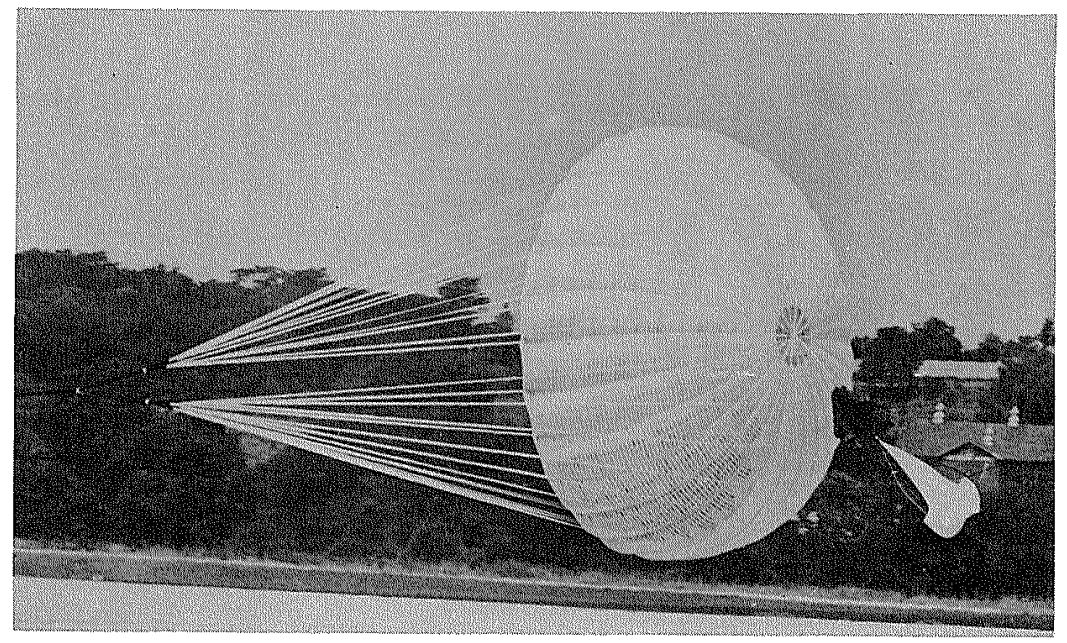
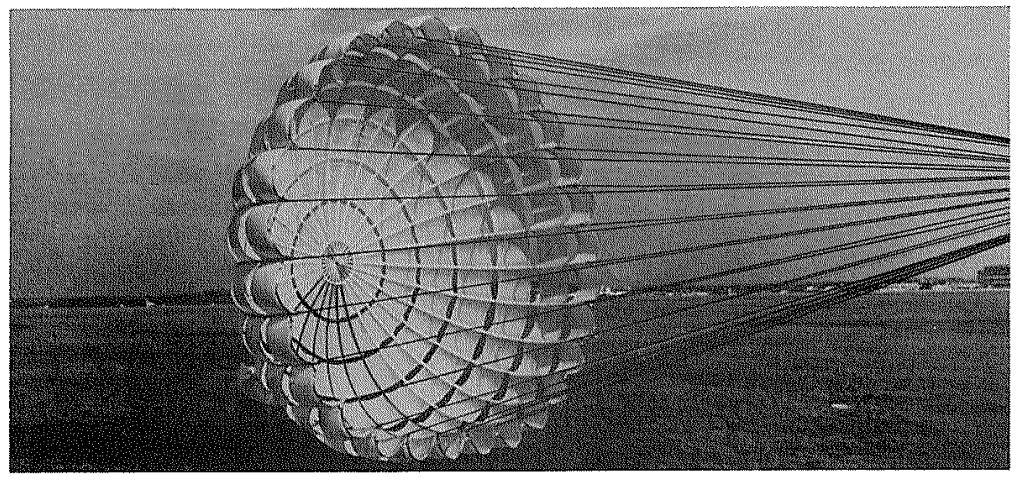
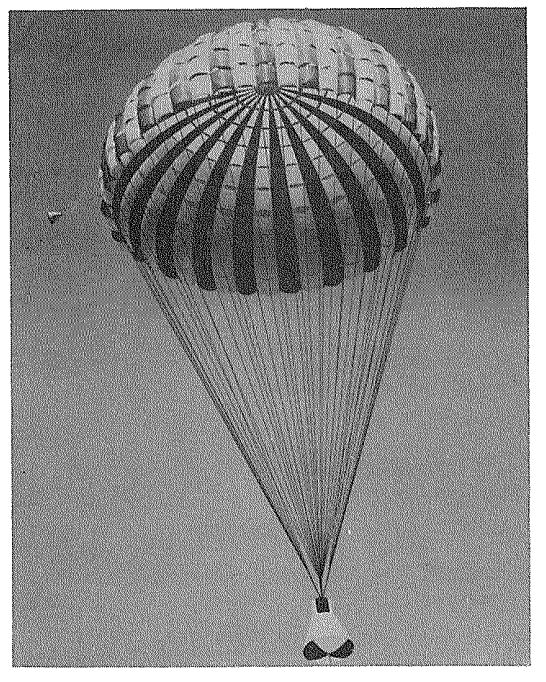
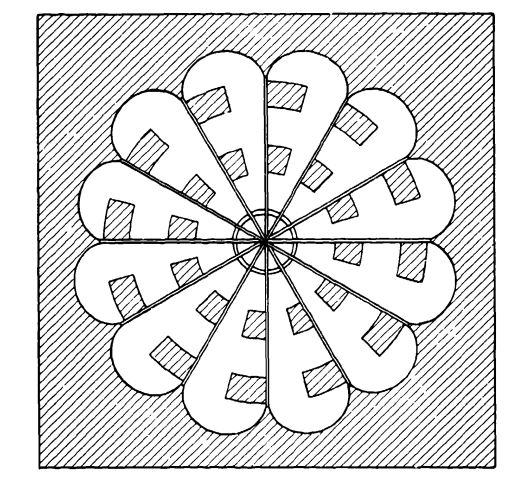
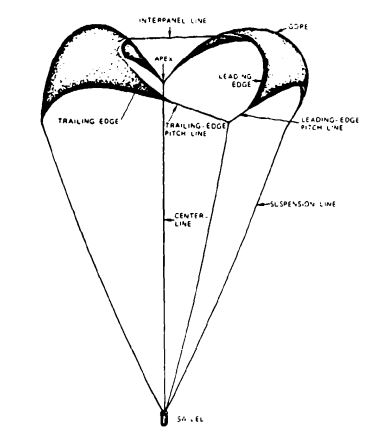
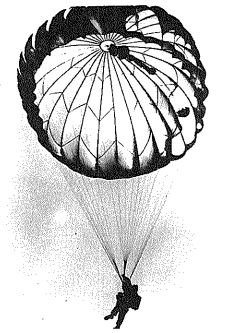
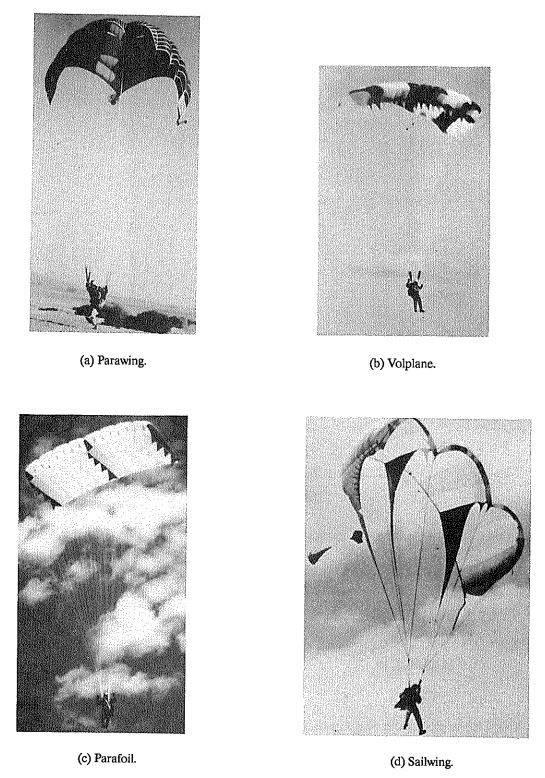
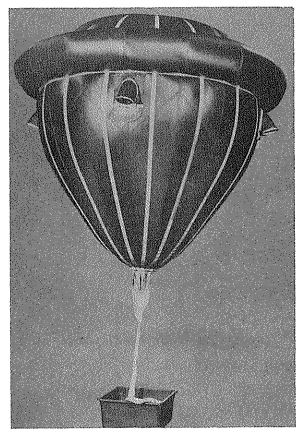
Figures 5-1 through 5-15 show some of the more common parachute-type decelerators listed in Tables 5-1 through 5-5.
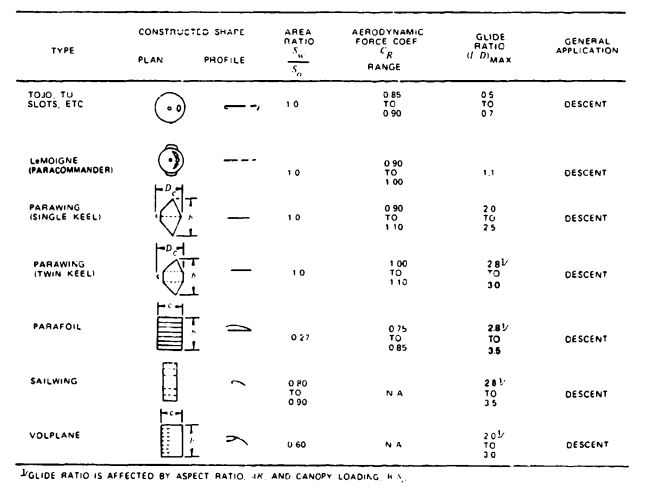
Note: Maneuverable parachutes with a glide ratio L/D of 2.5 or better have been defined in the literature as "hi-glide parachutes." This includes the parawing, the parafoil, the sailwing, and the volplane.

5.2 PARACHUTE DRAG AND WAKE EFFECTS
Parachute drag is an important performance parameter. because it determines the rate of descent, generally a primary performance consideration in the design of a parachute system. To maintain a required constant rate of descent, the drag of the parachute must equal the weight of the total system, as discussed in Chapter 4. The parachute drag, D, is
where
is the parachute drag coefficient related to the canopy surface area, dimensionless
is the canopy surface area, including the vent area and all openings and slots in the canopy,
is the dynamic pressure, equal to
For a given rate of descent, the dynamic pressure, q, is a fixed value. The product, , * is called the drag area of the parachute and is measured in square feet. A large drag coefficient, ,will result in a small canopy surface area, , and a low parachute weight and volume. Because these characteristics are highly desirable for large-diameter, final descent parachutes, a large drag coefficient is frequently the deciding factor in the selection of a parachute. The following design features and parachute canopy characteristics are known to produce high drag coefficients:
1. Conical, multi conical, or quarter-spherical canopy shapes
2. Rectangular or triangular canopy shapes
3. Long suspension lines
4. Low canopy porosity
5. Annular canopy shapes
6. Rotating parachutes
7. Gliding parachutes
The drag coefficient, , refers to the vertical component of the parachute velocity, as discussed in Chapter 4.
The glide velocity of a gliding parachute changes little with glide angle. However, the vertical component of the glide velocity (the rate of descent) decreases notably with an increasing glide ratio.
Rectangular and triangular parachutes up to personnel-parachute size have been used successfully at lower speeds. Deployment of large rectangular and triangular parachutes has caused problems. The noncircular canopy design makes it difficult to maintain tension on all canopy elements during deployment and inflation.
Long suspension lines increase the inflated diameter of the canopy and result in a larger drag coefficient, which, for a given rate of descent, produces a smaller diameter and a lighter parachute assembly.
Rotating parachutes have been used successfully with diameters up to 10 feet. Attempts to use larger rotating parachutes have resulted in poor deployment and canopy wrap-up before full inflation. Inaccuracies in the angle of pitch of individual gores cause variations in parachute rotation and drag coefficient.
Decreasing the porosity increases the drag coefficient but also produces a less stable parachute and a higher opening force.
Canopy profiles of quarter-spherical shapes and the similar tri conical shapes have shown the highest drag coefficients for circular canopy designs.* In this manual, , and are interchangeable.
5.2.1 Canopy Shape and Suspension Line Length Effects
In 1949, the U.S. Air Force conducted model drop tests of 1600-square-inch parachutes under controlled conditions in the Lakehurst, New Jersey, airship hangar (Reference 5.1). These tests established several facts previously unknown or only suspected.
Solid textile parachutes of a round or cornered design and with a flat or shaped profile descended in a vertical line, but oscillated violently when dropped at rates of descent greater than 30 ft/s. The same parachutes, when dropped with a low weight, had a 10-ft/s rate of descent and descended in a stable, non-oscillating attitude, but glided at angles up to 45 degrees. In the 15-to 25-ft/s descent range, these parachutes combined oscillation with straight descent, or with glide but no oscillation. Gliding resulted in a low vertical velocity component and a high drag coefficient. Vertical descent with oscillation at the higher rates of descent resulted in lower vertical drag coefficients.
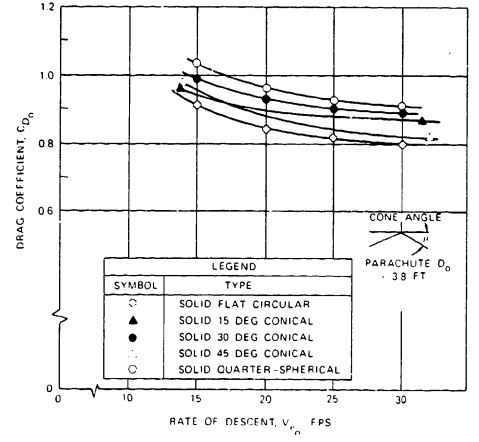
For the same surface areas, conical and quarter-spherical canopies had higher drag coefficients than circular flat canopies. Figure 5-16 shows that, at a rate of descent of 20 ft/s, a 30-degree conical parachute has a 9.5% higher drag coefficient than a flat, circular canopy, and a quarter-spherical canopy has a 14.5% higher drag coefficient. These tests were the basis for the quarter-spherical profiles of the ringsail and the triconical parachute canopies.
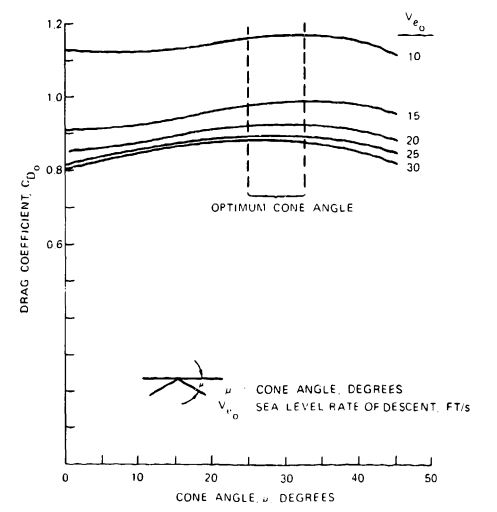
The model test results were confirmed in full-scale drop tests conducted at El Centro, Calif., with modified 28-foot-diameter personnel parachutes. Successive gores were removed from a 28-foot-diameter, flat, circular canopy to convert it into a conical parachute of increasing cone angles. The vertical drag coefficient, , increased with increasing cone angle and decreasing rates of descent. A cone angle of 25 to 30 degrees was the optimum angle, as shown in Figure 5-17 and Reference 5.2.
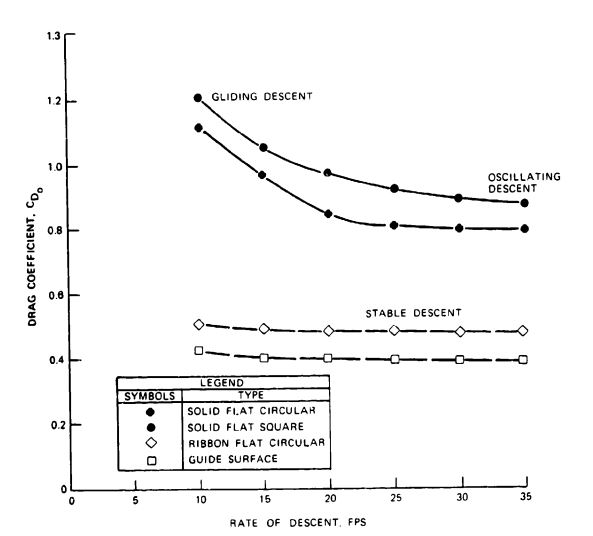
Data from Reference 5.1 (Figure 5-18) demonstrate the difference in drag coefficient, , versus rate of descent for four parachute types. Two types are stable: a flat, circular, ribbon parachute and a guide surface parachute. Two types are unstable: a solid textile, circular, flat parachute and a solid textile, square, flat parachute. Figure 5-18 clearly shows the characteristic that unstable parachutes increase their drag coefficient with decreasing rates of descent because of the change in descent behavior from oscillation to glide.
An increase in drag coefficient for a specific parachute can be accomplished by increasing the length of the suspension lines (see Figure 5-19). The increase in suspension-line length causes the parachute to open wider with a larger inflated area, , and inflated diameter, . The drag coefficient, related to the inflated (projected) area, , decreases slightly with an increase in line length and a related increase in projected diameter (see Figure 5-19b). However, the drag coefficient clearly increases with an increase in suspension-line ratio, (Figure 5-19a).
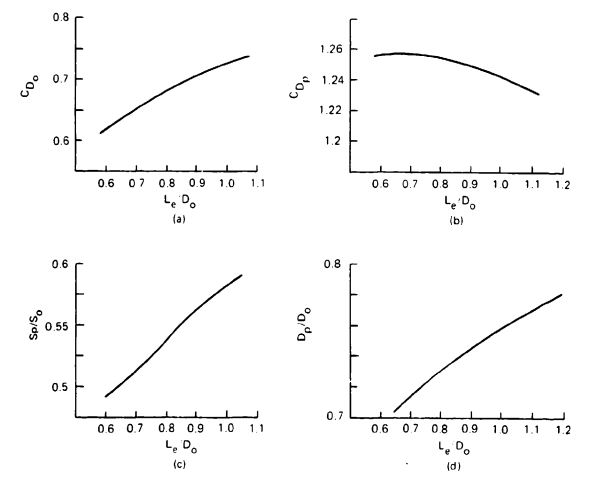
The slopes of the curves for area and projected diameter growth in Figure 5-19 indicate that using suspension-line ratios larger than 1.1 may have provided additional drag.
These data were obtained in model tests with 1-meter (3.3-foot)-diameter parachutes. Reference 5.3 provides background on the tests.
Figure 5-20 shows the possible increase in drag coefficient for line ratios, , up to 2.0. Parachutes with no skirt restrictions, such as flat and conical circular parachutes, increase the drag coefficient up to line ratios of 2.0. Parachutes with skirt restrictions, such as extended skirts and hemispherical canopies, show little drag coefficient increase at line ratios above 1.1. The data in Figure 5-20, taken from United States, British, and German sources, show relatively good concordance.
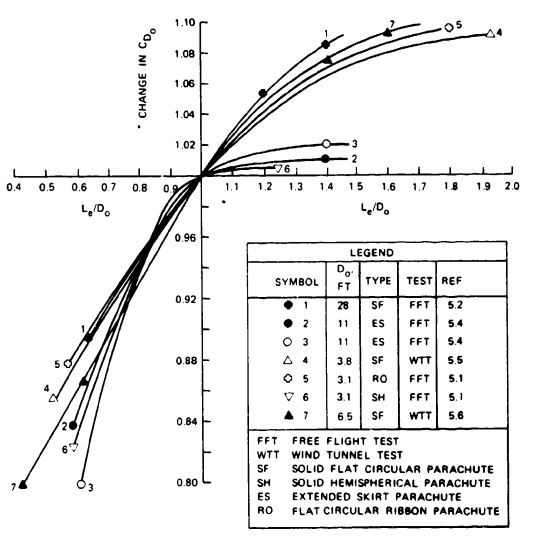
Calculations indicate that line-length ratios above 1.5 may be detrimental because of the associated weight increase of the longer lines. Systems that employ parachutes in clusters or use first-stage drogue chutes require long risers. Parts of these risers may be replaced by longer suspension lines on the individual parachutes to increase parachute drag and decrease the required parachute diameter and parachute assembly weight.
5.2.2 Forebody Wake Effect
Parachutes are always used in connection with a forebody, such as a parachute jumper, an aircraft, a load platform, or an Apollo-type space capsule. Each forebody produces a wake that affects the parachute, depending on the relationship of the inflated parachute diameter, , to forebody diameter, , and the distance between the end of the forebody and the leading edge of the inflated parachute canopy. Figure 5-21 illustrates the drag loss. A cargo container descending on a 100-foot-diameter parachute produces little wake effect, because both the diameter ratio, Failed to parse (Conversion error. Server ("https://wikimedia.org/api/rest_") reported: "Cannot get mml. Server problem."): {\displaystyle D_{p}/D_{B}} , and the distance between the container and the leading edge of the parachute, Failed to parse (Conversion error. Server ("https://wikimedia.org/api/rest_") reported: "Cannot get mml. Server problem."): {\displaystyle L_{T}} , are large. The inflated diameter of the Apollo drogue chute was smaller than the diameter of the Apollo spacecraft. The distance between the leading edge of the parachute and the rear of the spacecraft was kept to a minimum to save weight. Many parachute jumpers have experienced the failure of a spring-loaded pilot chute that was ejected, but then collapsed and fell back on the jumper because of the blanketing or wake effect of the jumper's body.
Tests conducted in the NASA and Wright Field vertical wind tunnels determined that for vertical descending bodies, the parachute should be ejected to a distance equivalent to more than four times-and preferably six times-the forebody diameter, into good airflow behind the forebody. Applying the six-forebody-diameter rule has been successful on Apollo and other programs. Ejecting the parachute from a horizontal attitude or sideways out of the forebody wake can provide good inflation with shorter forebody-to-parachute canopy distances. However, successful inflation with shorter distances should be proven in tests of the most unfavorable-not the most favorable--deployment conditions.
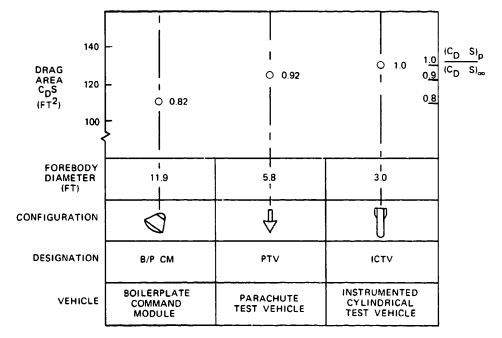
Deploying a small parachute in the wake of a large forebody also causes considerable loss in parachute drag and may affect the stability of the parachute. Drag losses of up to 25% have been experienced in wind-tunnel and free-flight tests. Figure 5-21 presents parachute drag losses caused by forebody wake measured in wind-tunnel and free-flight tests. The two dotted lines (I in Figure 5-21) encompass parachute wake loss data measured in wind-tunnel tests by the University of Minnesota and the California Institute of Technology (Cal Tech) (References 5.7 through 5.9). Superimposed on this wind-tunnel data are free-flight test results obtained on the reefed 16.5-foot-diameter Apollo command module drogue chute tested behind three different forebodies. This drogue chute was tested behind (1) an 11.9-foot, boilerplate command module (CM) (II in Figure 5-21), (2) a 5.8-foot-diameter parachute test vehicle (PTV) (III), and (3) a 36-inch-diameter instrumented cylindrical test vehicle (ICTV) (IV) (Reference 5.10). These measured Apollo parachute data agree well with data from the University of Minnesota and the Cal Tech wind-tunnel tests.
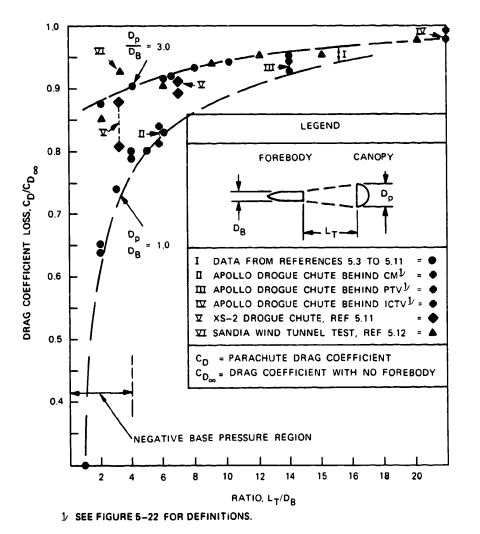
Parachute wake effect data measured in wind-tunnel tests behind a 3/8 scale model of the ejectable nose section of the XS-2 research aircraft (V)(Reference 5.11), and data measured on model parachutes by the Sandia National Laboratories (VI) (Reference 5.12), are included in Figure 5-21.
Figure 5-22 details the measured forebody wake effect on the 16.5-foot-diameter ribbon drogue chute of the Apollo Command Module shown in Figure 5-21.
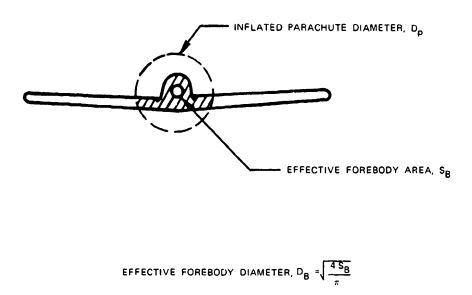
Many forebodies, such as aircraft, have a noncylindrical cross section. Figure 5-23 demonstrates a method that has been used successfully to convert an odd-shaped cross section to a circular area. The area of the forebody, , included in the inflated area of the parachute behind the forebody is converted into the area of an equivalent circle. The diameter of this circle, , is then used as the reference forebody diameter.
5.2.3 Measured Drag Coefficients of Various Types of Parachutes
Drag coefficients are discussed in this section for solid flat, conical, triconical, extended-skirt, hemispherical, annular, and cross parachutes. These data were calculated from drop tests conducted over a period of time, primarily at the El Centro test facility. The main source for determining rates of descent were phototheodolite measurements, although some older tests used the 300-foot drop-line method. Most of the data were collected by the author; the summary data in Figure 5-24 were plotted by E. Ewing of Northrop-Ventura and presented in Figure 6-35 of Reference 2.1.
Figure 5-24 plots the measured drag coefficient data for solid, flat circular, circular conical, triconical, extended-skirt, ringsail, annular, and ringslot parachutes. The data confirm the previously stated fact that triconical, annular, and extended-skirt parachutes have the highest drag coefficients. The data also confirm that, similar to model parachutes (Figure 5-16), the drag coefficients of unstable, large parachutes decrease with increasing rates of descent.
References 5.13 through 5.20 refer to solid circular flat, circular conical, and triconical parachutes in general, and not to any specific parachute evaluated for the drag coefficient data in Figure 5-24.
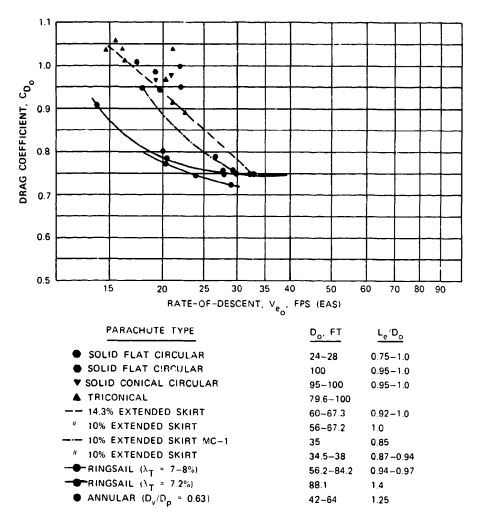
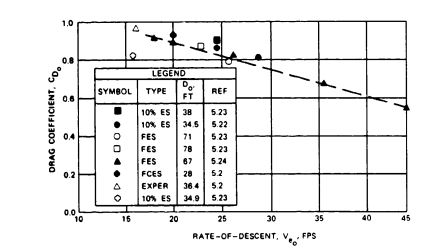
Extended-Skirt Parachutes. Figure 5-25 shows the drag coefficient versus rate of descent for various types of extended-skirt parachutes. These data are the result of numerous tests conducted with individual parachutes. The extended-skirt parachute was developed at Lakehurst, New Jersey, by the U.S. Navy in the late 1940s (Reference 5.21). In 1952, the U.S. Air Force used the extended-skirt design to develop the T-10 Troop Parachute (Reference 5.22). Extended-skirt parachutes designed for recovery of the Q-2 and the USD-5 drones achieved high drag coefficients combined with reasonably good stability of about 10 degrees of oscillation (References 5.23 and 5.24).
Combining the high drag effect of the triconical parachute with the good stability and low opening shock characteristics of the extended skirt design may produce a parachute combining the best features of both designs.
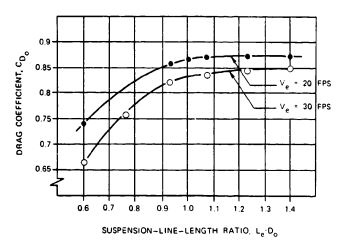
The sensitivity of extended-skirt parachutes to suspension-line length is shown in Figure 5-26. These tests were conducted with an 11.8-foot-diameter, 10% extended-skirt parachute in the Wright Field vertical wind tunnel. The data also demonstrate the effect of velocity on the drag coefficient.
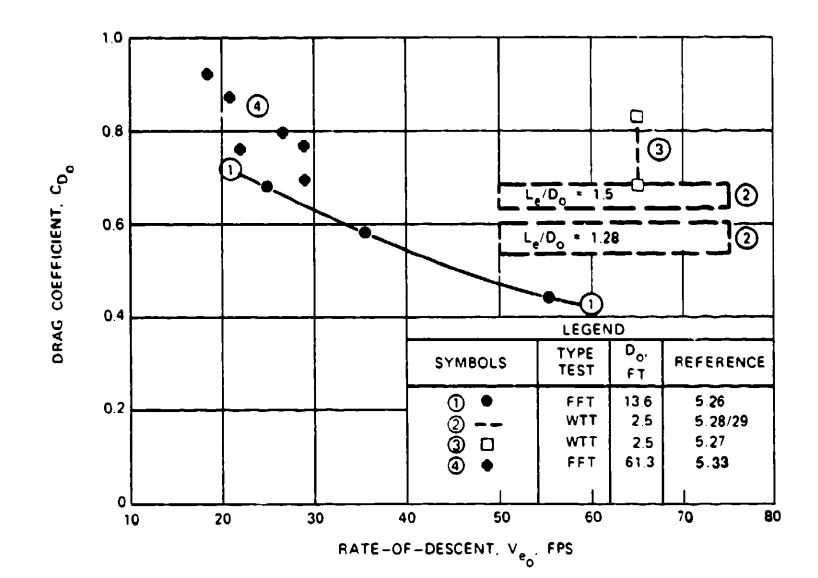
Cross Parachute. In recent years, the cross parachute has been used for aircraft and ordnance deceleration as a low-cost replacement for the ringslot parachute. The cross parachute was first tested in 1947 by the Naval Ordnance Laboratory (Reference 5.25) and was reintroduced in 1962 as the French cross parachute (References 5.26 and 5.27). The Naval Surface Warfare Center (NSWC) at Silver Spring, Md., has conducted many aerodynamic and stress investigations on cross parachutes (References 5.28 to 5.32). NSWC is using the cross parachute for the stabilization and retardation of mines, see section 8.6.4. Reference 5.33 describes the use of a cross parachute as a final descent parachute. Figure 5-27 shows the cross parachute drag coefficient as a function of rate of descent evaluated from the NSWC programs. This stable parachute increases its drag coefficient with a decreasing rate of descent, a fact previously observed only on unstable parachutes. Drag and stability of the cross parachute depend on the arm's diameter-to-width ratio (W/L), on the number and length of suspension lines, and on cloth porosity. To conform togeneral use, the nominal diameter, , is used in this manual instead of the arm length to define cross parachute diameter. Reports published primarily by the NSWC should be consulted before using this parachute. Wind-tunnel and water-tank tow tests on cross parachutes were conducted by the University of Leicester, England (Reference 5.34 and 5.35).
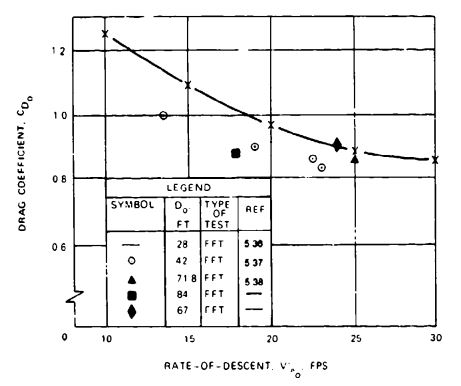
Annular Parachute. The annular parachute was developed in 1947 and named the airfoil parachute (Reference 5.36). Figure 5-28 shows its high drag coefficient. The parachutes with individual symbols in the figure are annular parachutes used in connection with a ringslot or ringsail engagement parachute for midair retrieval systems (References 5.37 and 5.38).
Ribbon Parachutes. Section 5.8 contains drag data on ribbon parachutes for the subsonic and supersonic range. Ribbon parachute performance depends to a large extent on selection of the right porosity. Design data, including the required porosity for a particular parachute size and application, are discussed in Chapter 6. References 5.39 through 5.47, published by various organizations, discuss performance, design details, and subsonic and supersonic applications of ribbon parachutes.
The influence of Mach number on the drag of ribbon-type drogue chutes is discussed in section 5.8.
Ringslot Parachutes. References 5.48 and 5.49 give design details on ringslot parachutes. A drag coefficient, , of 0.65 has been measured in free-fall tests. Selection of the proper total porosity, in accordance with Chapter 6, is important. Ringslot parachutes used as landing deceleration parachutes for aircraft experience a drag coefficient reduction from 0.65 to 0.60 because of the large wake behind the aircraft.
Ringtail Parachutes. Reference 5.50 is a summary report on ringsail performance, design, and application. These parachutes were used as the main descent parachutes for the Mercury, Gemini, and Apollo spacecraft and for the ejectable crew module of the F-ill aircraft.
Hemisflo Parachute. This supersonic ribbon parachute should be used at speeds of Mach 2 or higher. References 5.51 and 5.52 provide information on the development, design, and application of hemisflo parachutes.
Guide Surface Parachute. This parachute was developed as a high-stability, low drag parachute for the stabilization of bombs, mines, and torpedoes. It combines good stability with excellent damping characteristics. For details see References 5.53 and 5.54.
Disk-Gap-Band Parachute. Some information on this parachute, used successfully to land the Viking spacecraft on the planet Mars, is contained in References 5.55 and 5.56.
Rotating Parachutes. Several types of rotating parachutes have been used successfully. Angled vents in the parachute canopy rotate the parachute. Centrifugal forces acting on the canopy and suspension lines increase the projected diameter, resulting in a high drag coefficient. Attempts to use rotating parachutes with diameters greater than 10 feet have been unsuccessful because of deployment and canopy wrap-up problems. References 5.57 through 5.59 provide information on the three best known types of rotating parachutes.
Maneuverable (Gliding) Parachutes. Maneuverable gliding parachutes and their performance characteristics are discussed in section 5.9.
Balloon-Type Decelerators. These deceleration devices, including the Goodyear ballute, are discussed in section 5.8.
5.2.4 Effect of Reynolds Number on Parachutes
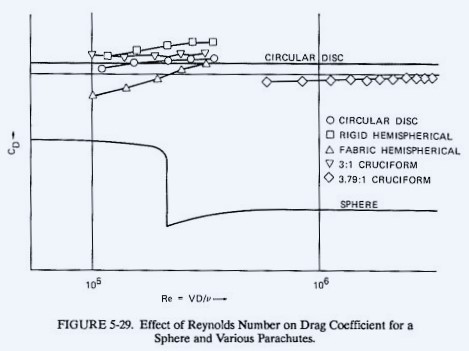
Chapter 4 states that parachutes, unlike airfoils, operate in turbulent flow because of the separation of the airflow at the leading edge of the parachute canopy. For this reason, the Reynolds number does not appear to change the drag coefficient of parachutes. Measured data on parachute drag coefficient versus Reynolds number are compared in Figure 5-29 with the known Reynolds number effect on the drag coefficient of a sphere. These data are taken from Reference 2.1
5.3 STABILITY OF PARACHUTE SYSTEMS
5.3.1 General Definition
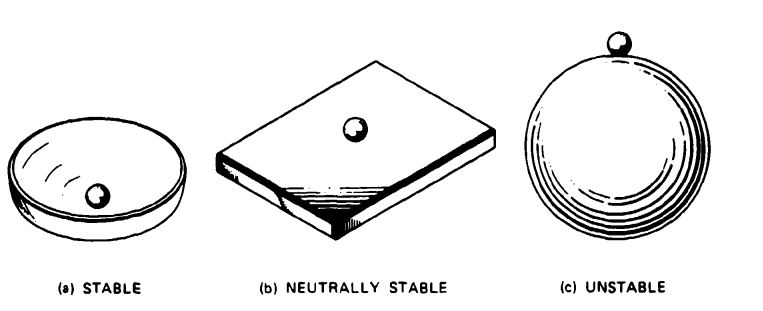
Stability may be viewed as the tendency of a body to return to a position of balance or equilibrium after a displacement from that position. Controllability may be defined as the ease of causing that movement, or as the effectiveness of the mechanism used to cause the body to return to its original position. Various concepts of stability can be illustrated by simple examples. In Figure 5-30a, a ball is shown at rest in a concave depression. A displacement of the ball will result in gravity restoring it to its original position. This state is called "stable." If the ball is placed on a flat surface. a displacement of the ball from its position of rest will cause the ball to come to Test at a different location on the flat plate, with no tendency for the ball to return to its original position; this state is termed "neutrally stable" (Figure 5-30b). Figure 5-30c shows a ball placed in a state of equilibrium atop a larger spherical ball. Clearly, any displacement of the small ball on the large sphere causes the ball to continuously move away from its original position of stability. This condition is termed "unstable." In the three simple examples, we have considered the conditions connected with static stability.
Dynamic stability refers to the continued motion of a moving body and may be illustrated by considering the ball on the concave surface in Figure 5-30a. The friction forces on the ball are always in a direction opposite to its motion. The friction forces, positive damping effect, together with the gravity component, make the ball tend to oscillate with a decreasing amplitude until it finally achieves the illustrated position of static stability. A ball in this dynamic environment is called "dynamically stable." If the aerodynamic forces of air resistance and the mechanical frictional forces could be reduced to zero-an impossible condition-there would be no damping force on the ball, and a small displacement of the force applied to the ball would cause an indefinite oscillation of constant amplitude. Such a condition is termed "neutrally dynamically stable." If friction force is overcome by some external force-for example, a propulsion force-the ball would oscillate with an increasing amplitude and would not return to its position of equilibrium; this condition is called "dynamically unstable."
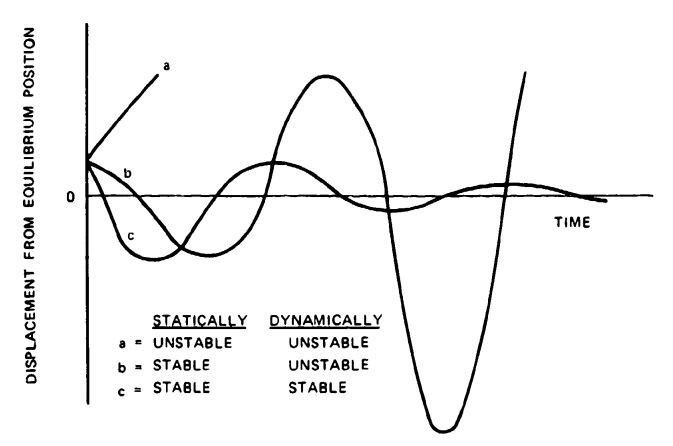
These conditions of dynamic stability are graphically illustrated in Figure 5-31, which demonstrates the stability of three bodies. Body "a" is dynamically and statically unstable. Body "b" is statically stable but dynamically unstable, resulting in ever-increasing oscillations. Body "c" is dynamically and statically stable, resulting in oscillations dampened with time.
The fact that a body is statically and dynamically stable is frequently not sufficient. For example, an automobile without shock absorbers is statically and dynamically stable in its spring motions but may provide an uncomfortable ride because of insufficient damping of its body oscillations. Installation of shock absorbers increases positive damping and causes a rapid decrease of the body oscillations with time, thereby providing a comfortable ride.
A statically stable parachute may require excessive time to decrease its oscillation after an external disturbance, such as a wind gust, indicating that the parachute's damping characteristics are inadequate for stabilizing an unstable body.
In the case of an aircraft, good static and dynamic stabilities are desirable for large cargo-type aircraft, but this stability counteracts fast changes in attitude and position required for fighter aircraft, which are generally built with low or neutral static stability. In recent years, aircraft requiring a high degree of mobility have been designed with a slightly negative static stability, thus increasing mobility and decreasing the size and drag of the control surfaces.
5.3.2 Parachute Stability
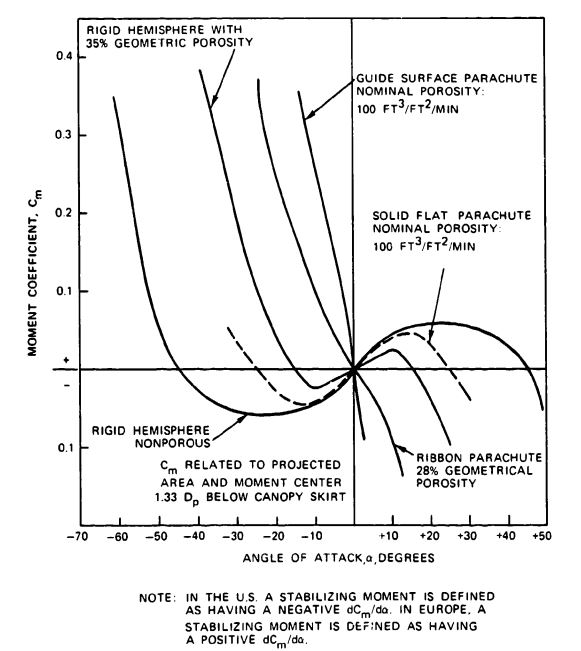
Stability is defined as the tendency of a body to return to a position of equilibrium after displacement. Parachute engineers frequently use the term stability loosely. If two airdrop platforms descend, each on a 100-foot-diameter parachute, and one parachute oscillates 30 degrees and the other 5 degrees, observers frequently call the former parachute system unstable and the latter stable. In reality, both parachute systems are statically unstable in the oscillating mode but are sufficiently dampened dynamically to stay within their ranges of oscillation without increasing the oscillation amplitude. It is more precise to define these parachutes as oscillating 30 degrees or 5 degrees; and, if possible, to state that disturbances such as those caused by wind gusts are dampened within a given number of full oscillations. The parachute oscillating 5 degrees most likely meet the requirements for airdrop; however, the same parachute is unsuitable for stabilizing airdropped bombs or torpedoes. For this application, a parachute with zero oscillation and good damping is required. As defined later in this section, a parachute meeting this requirement has a steep negative over a wide range of angles of attack.
Why should one parachute have no oscillation and strong damping characteristics while another parachute oscillates violently? Figure 5-32 explains this difference by showing the airflow around several types of parachute canopies and rigid hemispheres. The airflow, made visible with smoke ejected from equally spaced nozzles in front of the parachute models, acts as streamlines, as explained in Chapter 4. Figure 5-32a shows the airflow around an imporous hemisphere. Airflow cannot get through the canopy but goes around and separates on the leading edge of the hemisphere in alternating vortexes, forming what is called the Karman Vortex Trail. The separation causes alternate pressure areas on opposite sides of the canopy, and these pressure areas produce the parachute's oscillations.
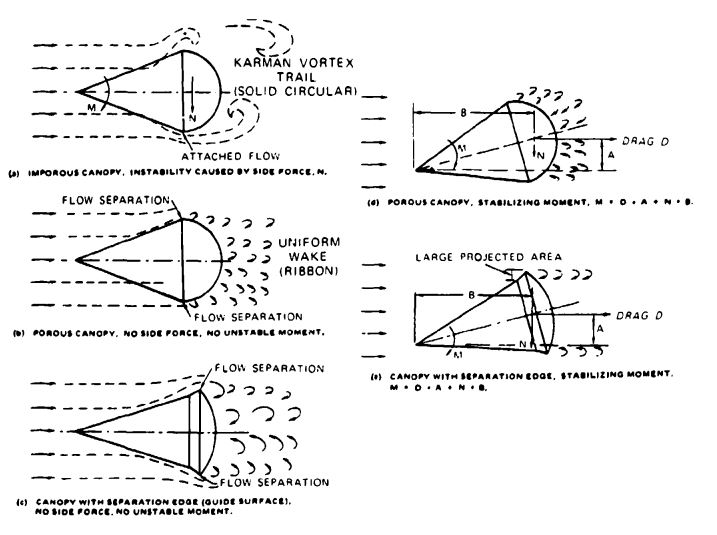
Figure 5-32b shows the effect of openings in the canopy. Part of the air flows through the canopy and forms a uniform wake consisting of small vortexes. In addition, the airflow separates uniformly around the leading edge of the canopy, eliminating the destabilizing alternate flow separation of the Karman Vortex Trail. Uniform wake and airflow separation is the principle of the ribbon parachute and all slotted parachute canopies.
The guide surface parachute (Figure 5-32c) has a sharp separation edge around the skirt of the canopy, creating a strong, uniform airflow separation around the leading edge. In addition, the inverted leading edge (guide surface) creates a large, stabilizing normal force. Both the normal force, N, and the drag force, D, create a stabilizing moment if the parachute is displaced from its zero-angle-of-attack position (Figure 5-32e). The known main design features for creating stable parachutes are uniform airflow separation around the leading edge of the canopy, airflow through the canopy, and a large restoring moment such as that generated by a guide surface.
The static stability of various parachutes has been measured numerous times in wind-tunnel tests. Figure 5-33 plots the moment coefficient of several parachute types and of rigid hemispheres, as measured by the University of Minnesota (References 5.60 and 5.61). A negative of the moment coefficient curve indicates that the parachute is stable and will return to its zero-angle-of-attack position after a disturbance. The solid, flat. circular canopy is a typically unstable parachute. It will oscillate between 25 degrees, but if deflected more than 25 degrees it will return to the 25-degree position. The ribbon and guide surface parachutes will return to their zero-angle-of-attack attitude if displaced, as indicated by the negative slope of the curve going through the zero-angle-of-attack position for both parachute types.
The guide surface parachute has the steepest , and, therefore, the strongest stabilizing moment and best damping characteristics of all known parachutes.
Larger parachutes oscillate less than small parachutes. A 3-foot-diameter solid flat circular parachute manufactured from standard 1.1-oz/y 2 ripstop material, tested in a wind tunnel, will oscillate about ± 35 to 40 degrees. The standard 28-foot-diameter personnel parachute oscillates about ± 30 to 35 degrees. The 100-foot-diameter G-11 cargo parachute oscillates about 10 to 20 degrees. The 200-foot-diameter cargo parachute manufactured from 1.6-oz/y 2 material with about the same porosity as the other parachutes (described in Reference 5.14) oscillates less than 5 degrees. Ludtke discusses oscillation problems in Reference 5.62.
5.3.3 Stability of a Parachute Body System
Parachutes that are used with stable air vehicles must also be stable and not interfere with the inherent stability of the vehicle. Parachutes with good stability and high drag are used, such as the ribbon, ringslot, and cross parachutes. If a fast-falling, unstable body must be stabilized while maintaining a high rate of descent, a parachute with a strong negative , such as a guide surface parachute, may be preferable. For each parachute assembly, a compromise between required stability, weight, volume, and cost determines the final selection.
The following parachute application ranges have been established based on many years of practical experience.
Aircraft Landing Deceleration. Aircraft are inherently stable and do not require aircraft landing deceleration parachutes to contribute to their stability. Therefore, high drag stable parachutes that do not interfere with the aircraft controllability are used. Ribbon, ringslot, and cross parachutes are used primarily for aircraft landing deceleration.
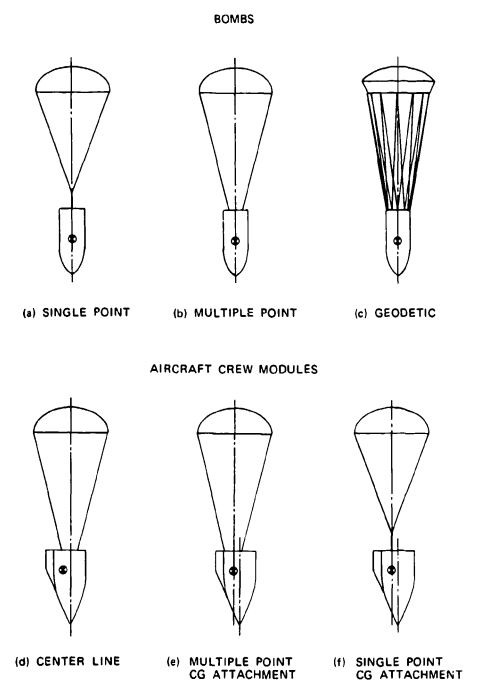
Bomb Stabilization. During World War II, the Germans developed parachute-stabilized bombs that enabled them to shorten the length of the bomb and to store more bombs in existing aircraft bomb bays. These fast-falling bombs required a low drag, highly stable parachute with good damping capability to obtain the desired stability. The guide surface parachute was developed specifically for this application as a low drag, high-stability parachute (Reference 5.53). A single riser attachment did not provide a sufficiently stable parachute-bomb system, and a more rigid connection between the bomb and the parachute was required. Figure 5-34 contains two examples of rigid parachute-bomb connections: the multiple-point attachment on the circumference of the bomb and the geodetic attachment. The geodetic attachment is the best solution but is more complex.
Torpedo and Mine Stabilization. Mines and torpedoes that are airdropped from low altitudes are equipped with retardation parachutes to
1. Decelerate the store to an acceptable water entry velocity, generally below 200 ft/s.
2. Obtain a water entry angle that avoids ricochet.
3. Avoid store oscillation and associated store damage at water impact. Guide surface, ribbon, ringslot, and cross parachutes are being used successfully for this application.
Bomb Retardation. Bombs dropped at high speeds from low-flying aircraft must be retarded to
1. Obtain a steep impact angle to avoid ricochet.
2. Permit the aircraft to escape the effective range of the exploding bomb.
3. Obtain a good fragmentation pattern associated with a steep impact angle.
Stable parachutes with good drag characteristics used for this one-time application include ribbon, ringslot, and cross parachutes as well as the inflatable ballute-type retarders.
Ejection Seat, Encapsulated Seat, and Crew-Module Stabilization and Retardation. All three aircraft escape systems need parachutes for stabilization and retardation. Stabilization is required in pitch, yaw, and roll; parachutes can provide stabilization in pitch and yaw, but are poor for roll control. For descent from a high altitude, a roll control of not more than 2 to 3 rpm is necessary for aviator comfort. This control can be obtained with a relatively large drogue chute with an equivalent sea-level rate of descent of 120 to 150 ft/s.
The aircraft crew-module stabilization in Figure 5-34 demonstrates the problem of stabilizing an asymmetrical body with the center of gravity (CG) off the center line of the vehicle. In the example shown, the drogue chute had to be attached offset to the nose section of the XS-2 research aircraft to ensure that the parachute force line would run through the CG of the crew module with the module hanging at a -2 degree zero lift attitude to eliminate destabilizing side forces (Reference 5.11).
The stability relationship of parachute and forebody is quite complex in systems where unstable forebodies must be stabilized by minimum size parachutes. Both the forebody and the parachute can oscillate in a 360-degree plane. The stability of such two-body, multi-degree-of-freedom systems has been investigated by several authors (References 5.63 through 5.67).
Neustadt showed that deploying a parachute opposite the oscillating motion of the forebody may increase the parachute force by as much as 20% (Reference 5.68).
5.4 PARACHUTE INFLATION PROCESS
5.4.1 Opening Force Investigations
Many attempts have been made to develop theoretical solutions to the parachute inflation process and obtain quantitative values for opening time and force. Investigations by Mueller, Scheubel, O'Hara, Rust, Heinrich, Wolf, and Purvis, defined in References 5.69 through 5.75, have increased the understanding of the parachute opening process, including the effect of apparent mass. However, no satisfactory practical solution for calculating filling time and parachute opening forces has evolved. The analytical solution of the opening process has been complicated in recent years by the development of means for controlling parachute inflation, such as reefing, sliders for steerable parachutes, pull-down vent lines, and related devices. While these methods provide control of parachute inflation, and thereby the opening forces, they also interfere with the parachute's natural inflation process. A good account of the present status of the parachute inflation theory was presented by D. Wolf in 1982 during the University of Minnesota Short Course on Parachute Systems Technology (Reference 2.17).
In 1942 Pflanz developed a numerical method for calculating parachute opening forces (References 5.76 and 5.77). He assumed that the drag area of the parachute or of any drag device increased from a low value to 100% in a given time and in a mathematically definable form, such as convex, concave, or linear. The parachute filling distance was assumed to be constant for a specific parachute. The Pflanz method includes altitude effects but does not include gravity effects or drag area overshoot after full opening.
Schuebel was the first to investigate the effect of the apparent mass on the parachute opening process. He defined apparent mass as both the air mass inside the inflating canopy and the air mass outside the canopy that is affected by the inflation process (Reference 5.70).
Modern, high-speed computers make it possible to calculate the time-dependent force-velocity-trajectory history of the parachute opening process for complex recovery systems. This calculation was first accomplished in 1960 by Space Recovery Systems, Inc. (Reference 5.23). The computer results agreed well with the forces measured in free-flight tests.
This force-velocity-trajectory approach was used in an extended form for predicting the parachute opening forces of the Gemini and Apollo drogue and main parachutes (References 5.78 and 5.79). McEwen gives an excellent review of previous efforts and recommends that inflation distance, not inflation time, be used as the reference for the inflation process.
For a parachute-vehicle system moving in space (Figure 5-35), the trajectory equations can be written in the form shown in the figure.
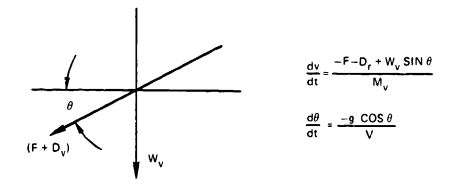
The parachute force, F, as a function of time is
Failed to parse (Conversion error. Server ("https://wikimedia.org/api/rest_") reported: "Cannot get mml. Server problem."): {\displaystyle F=(C_{D}S)_{p}\rho /2v^{2}+(m_{a}+m_{v}+m_{p}){\frac {dv}{dt}}+v{\frac {dm_{a}}{dt}}+W_{v}sin\theta }
where
F = parachute force acting parallel to the flight trajectory, lb
= drag of the vehicle (payload), lb
= weight of the vehicle or payload, lb
= trajectory angle against the horizontal, degrees
g = deceleration of gravity, ft/s2
= parachute drag area, ft2
= density of air, slugs/ft2
v = trajectory velocity, ft/s
= apparent mass (added mass), slugs
= mass of parachute, slugs
= mass of the vehicle or payload, slugs
= weight of the parachute, lb
The drag of the vehicle, , depends on the drag area of the vehicle and on the instantaneous dynamic pressure, which changes during the opening process of the parachute.
The trajectory angle, , changes from the launch or deployment angle to vertical most rapidly during and after parachute inflation.
Changes in the value of the acceleration of gravity, g, do not affect the outcome at altitudes below 100,000 feet.
The parachute drag area, , increases from close to zero at line stretch to 100% at full open canopy.
Density, , changes with altitude; this change must be considered for longer trajectories. Both parachute and payload are assumed to have the same velocity and the same trajectory angle.
The apparent or added mass, , is calculated by multiplying volume by density and by a form factor that depends on the particular parachute type. The apparent mass at an altitude of 40,000 feet is only one-quarter of the apparent mass at sea level, because apparent mass depends on density. Therefore, the apparent mass affects the magnitude of the parachute opening force at a given altitude.
In the parachute force equation, the vehicle weight is . Using the sign convention of Figure 5-35, a parachute opening in a vertical attitude will have a force that is one unit weight higher than the force of a parachute opening in a horizontal attitude. This force difference must be considered in planning parachute test programs.
5.4.2 Parachute Canopy Inflation
Parachute inflation is defined as the time interval from the instant the canopy and lines are stretched to the point when the canopy is first fully inflated. Figure 5-36 shows the phases of canopy inflation. The canopy filling process begins when canopy and lines are stretched and when air begins entering the mouth of the canopy (a). After the initial mouth opening, a small ball of air rushes toward the crown of the canopy (b). As soon as this initial air mass reaches the vent (c), additional air starts to fill the canopy from the vent toward the skirt (d). The inflation process is governed by the shape, porosity, and size of the canopy and by air density and velocity at the start of inflation. Inflation is slow at first but increases rapidly as the mouth inlet of the canopy enlarges (e) and the canopy reaches its first full inflation (f). Most solid textile canopies overinflate and partially collapse because of the momentum of the surrounding air (g). Several factors contribute to an orderly, repeatable inflation process and to a low, uniform opening force. The amount of air moving toward the canopy vent at point (b) should be small to avoid a high-mass shock when the air bubble hits the vent of the parachute. The inflation of the canopy should occur axis-symmetrically to avoid overstressing individual canopy parts. Overinflation of the canopy after the first initial opening should be limited to avoid delay in reaching a stable descent position.
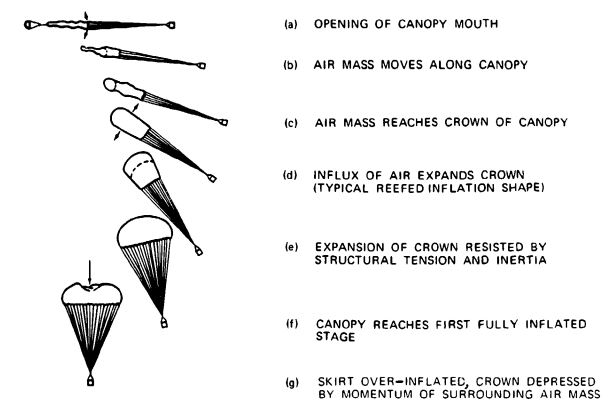
Methods have been developed to control the inflation of the canopy; the most frequently used is canopy reefing. Reefing stops the inflation of the canopy at one or more steps between stages (c) and (f), thereby limiting the parachute opening force to a preselected level.
Reefing is also required for uniform inflation of parachutes in a cluster. Stopping the inflation of all cluster parachutes at a point close to stage (d) of Figure 5-36 allows all parachutes to obtain an initial uniform inflation-a prerequisite for a uniform final inflation--without running into a lead/lag chute situation with widely varying parachute forces. Other means for controlling the parachute opening include ballistic spreader guns, sliders for gliding parachutes, and pull-down vent lines.
5.4.3 Canopy Inflation Time
Knowledge of the canopy filling time, defined as the time from canopy (line) stretch to the first full open canopy position, is important. Mueller and Scheubel reasoned that, based on the continuity law, parachutes should open within a fixed distance, because a given conical column of air in front of the canopy is required to inflate the canopy (References 5.69 and 5.70). This fixed distance is defined as being proportional to a parachute dimension such as the nominal diameter, . This assumption was reasonably confirmed in early drop tests with ribbon parachutes. French and Schilling, in papers published in 1968 and 1957, confirmed this assumption (References 5.80 and 5.81). Using the fixed-distance approach and the definitions in Figure 5-37, the filling distance for a specific parachute canopy can be defined as .
With as the canopy filling time, , can be defined as shown in Figure 5-37.

Because the parachute diameter, , is variable, the fixed nominal diameter, , is used to calculate canopy filling time
where
is the nominal parachute diameter, feet
v is the velocity at line stretch, ft/s
n is a constant, typical for each parachute type, indicating the filling distance as a multiple of , dimensionless.
The constant, n, will be called "fill constant" in subsequent discussions. The basic filling-time equation, , has been extended by Knacke, Fredette, Ludtke, and others. The following formulations have provided good results.
Ribbon Parachute
where n = 8 (Knacke).
This equation gives accurate results with ribbon parachutes when the canopy porosities recommended in Chapter 6 are used. For small-diameter ribbon parachutes investigated in high-speed sled and rocket tests, Fredette found the following relationship:
where is the total canopy porosity expressed as a percent of the canopy surface area, .
Solid Flat Circular Parachute
Wright Field investigations resulted in the following formulations:
where n = 4.0 for standard porosity canopies, and n = 2.5 for low porosity canopies.
Cross Parachute
An investigator at NSWC, Silver Spring, Md., recommends
where n = 8.7. The author has evaluated parachute fling-time data from free-flight tests and found that a formulation for filling time, where the line-stretch velocity, , is a linear function instead of an exponential function, gives satisfactory results in the medium-velocity range of about 150 to 500 ft/s. Table 5-6 lists the fill constant, n, in the equation for a variety of parachutes.
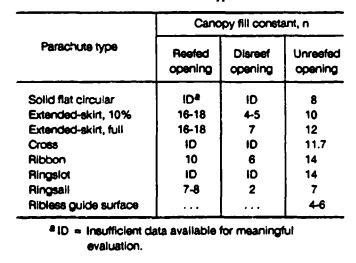
Additional fill-factor data can be found in Table 6-1 of Reference 2.1. The filling time of the various stages of reefed parachutes can be determined as follows:
Failed to parse (Conversion error. Server ("https://wikimedia.org/api/rest_") reported: "Cannot get mml. Server problem."): {\displaystyle t_{f_{1}}={\frac {n\ D_{o}}{v_{s}}}[{\frac {(C_{D}S)_{R}}{(C_{D}S)_{o}}}]^{1/2}} and
where , and Failed to parse (Conversion error. Server ("https://wikimedia.org/api/rest_") reported: "Cannot get mml. Server problem."): {\displaystyle t_{f_{2}}} are the reefed and disreefed filling times,
and are the velocities at line stretch and at disreef, ft/s
and are the reefed and full-open drag areas, .
Some solid textile, circular parachute types appear to have a critical opening velocity. At high velocities and high dynamic pressures, the canopy opens only partially. The drag of the partially opened parachute decelerates the parachute-vehicle system and the canopy opens fully. This type of opening can also occur on ribbon parachutes with porosities that are too high (Figure 6-23). Attempts to use this phenomenon for controlling the canopy inflation process, and thereby the parachute forces, have not been successful because of the variables involved and the difficulty of controlling the porosity of solid fabric canopies.
Some types of ribbon parachutes have been opened in the velocity range of up to Mach 4.0. Greene concludes that canopy filling time at supersonic speeds is constant, because the canopy operates behind a normal shock. Reference 5.82 presents test data that appear to confirm his investigations.
In a NASA test program to develop parachutes for planetary landing, ringsail, cross, and disk-gap-band parachutes were opened successfully at altitudes above 100,000 feet and at speeds exceeding Mach 3.0. Section 5.5 provides further details on high-altitude effects, and section 5.8 describes supersonic parachute applications.
5.4.4 Parachute Drag-Area Increase During Canopy Filling Process
The parachute drag area, Failed to parse (SVG (MathML can be enabled via browser plugin): Invalid response ("Math extension cannot connect to Restbase.") from server "https://wikimedia.org/api/rest_v1/":): {\displaystyle (C_DS)_p} , increases from 0 to 100% during canopy inflation. The drag-area-versus-time increase--linear, convex, concave, or random-is well known and has proven to be constant and repeatable for known parachute types (see Figure 5-38).
The drag-area-versus-time increase for reefed ribbon, ringsail, and extended-skirt parachutes is shown in Figure 5-39.


The shape of the drag-area-versus-time curve may be somewhat drawn out or compressed by reefing, changes in porosity distribution in the canopy, wide slots, or other means; however, the basic configuration of the curve is maintained for a particular type of parachute.
Drag-area-versus-time curves are obtained from wind-tunnel or free-flight tests by dividing the measured instantaneous force by the instantaneous dynamic pressure. This, more precisely, should be called a dynamic drag area, because it includes characteristics that affect the opening process, such as apparent mass and altitude density.
The evaluated drag-area-versus-time increase for unreefed, solid flat circular, ringslot, and personnel guide chutes (Figure 5-40), is taken from Reference 5.83. The author has added the typical drag-area increase for ribbon and extended-skirt parachutes, determined from numerous tests. Ribbon and ringslot parachutes have a strictly linear drag-area-versus time increase, and solid textile parachute types have a rather uniform, concave form of drag-area increase. Ludtke found that this increase of solid textile parachutes could be expressed by
Failed to parse (SVG (MathML can be enabled via browser plugin): Invalid response ("Math extension cannot connect to Restbase.") from server "https://wikimedia.org/api/rest_v1/":): {\displaystyle \frac{(C_DS)_x}{(C_DS)_o}=[(1-\eta)(\frac{t}{t_f})^3+\eta]^2}
where Failed to parse (SVG (MathML can be enabled via browser plugin): Invalid response ("Math extension cannot connect to Restbase.") from server "https://wikimedia.org/api/rest_v1/":): {\displaystyle \eta} is the ratio of the projected mouth area of the canopy at line stretch to the projected frontal area of the fully opened canopy.
Figure 5-41 plots drag-area increase for the 63-foot-diameter reefed ringsail main parachutes used with the Mercury space capsule. It shows a typical characteristic of ringsail parachutes-the increase in drag area during the reefed stage. The ringsail parachute inflates rapidly into an initial reefed stage and then grows slowly through inflation of additional rings. This characteristic is advantageous for single parachutes because it constitutes a form of continuous disreefing, a highly desirable feature.
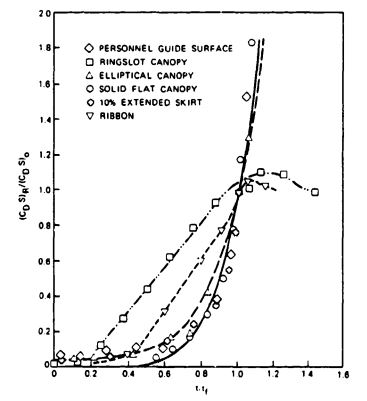
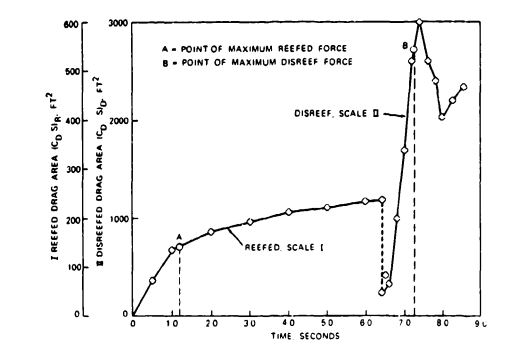
Figure 5-41 also demonstrates the extremely short disreefing time of 0.8 second. References 5.50 and 5.79 include figures that show the drag-area increase for a single 85-foot-diameter Apollo ringsail main parachute. The increase in drag area during the reefed stage proved detrimental for the cluster of the three Apollo main parachutes because it tended to support nonuniform inflation.
Reference 5.23 gives drag-area-versus-time data for reefed, extended-skirt parachutes. Several Sandia Reports (References 5.41 to 5.47) provide data on ribbon parachutes.
Drag-area-versus-time increase for a 101-foot-diameter, triconical parachute is shown in Figure 5-42. The drag area in the reefed stage remains constant, which is typical for all known types of parachutes except the ringsail. As shown in Figure 5-40, the disreef drag-area curve displays the same concave shape as other solid textile parachutes. The triconical parachute, in contrast to the ringsail parachute (Figure 5-41), has a long disreef time (Failed to parse (SVG (MathML can be enabled via browser plugin): Invalid response ("Math extension cannot connect to Restbase.") from server "https://wikimedia.org/api/rest_v1/":): {\displaystyle t_{f_2}} = 7.5 seconds), resulting in a relatively small canopy overshoot.
Data on drag-area-versus-time increase for the various parachute types are important for establishing the drag-area-versus-time diagrams required for the force-time-trajectory computer program described in this section and used in Chapter 7.
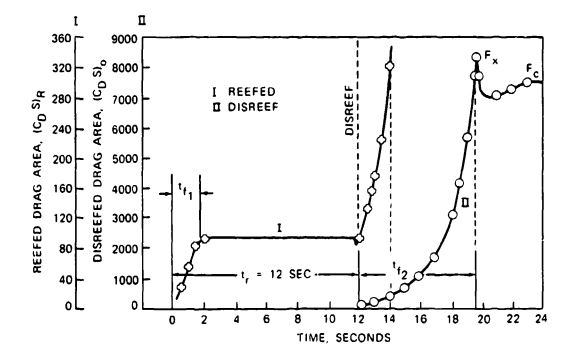
Recovery system engineers should evaluate and publish drag-area-versus-time diagrams to improve the database for computing the force-trajectory-time analysis of parachute recovery systems.
5.4.5 Effect of Canopy Loading, W/(CdS)p, on Parachute Opening Forces
Figure 5-43 is a force-time diagram of a parachute opening in a wind tunnel. This pattern is typical for parachutes without velocity decay during parachute inflation and is called the "infinite mass" condition, because the parachute acts as if it were attached to an infinite mass.
The same parachute dropped from an airplane and weighted for a 20 ft/s rate of descent will have the known force-time diagram of a personnel parachute (Figure 5-44).
The personnel parachute dropped from an airplane has a finite load and is referred to as being tested, or used, under a "finite mass" condition. The primary difference between infinite and finite mass conditions is that, under infinite mass conditions, the velocity does not decay during parachute opening, whereas, under finite mass conditions, the velocity during parachute opening decreases substantially. Infinite and finite mass conditions can also be defined as conditions of high and low canopy loading, Failed to parse (SVG (MathML can be enabled via browser plugin): Invalid response ("Math extension cannot connect to Restbase.") from server "https://wikimedia.org/api/rest_v1/":): {\displaystyle W/(C_DS)_p} .
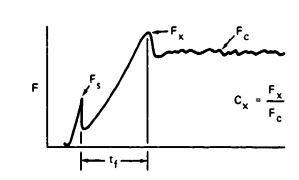
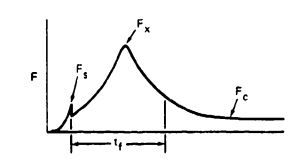
An additional typical difference between infinite and finite mass conditions is the location of the peak opening force, Failed to parse (SVG (MathML can be enabled via browser plugin): Invalid response ("Math extension cannot connect to Restbase.") from server "https://wikimedia.org/api/rest_v1/":): {\displaystyle F_x}
. For a parachute opened under infinite mass conditions, or high canopy loading, peak opening force occurs at the first full canopy inflation. The peak opening force of a parachute opened at a finite mass condition will occur long before the parachute canopy is fully open.
The relationship of the peak opening force, Failed to parse (SVG (MathML can be enabled via browser plugin): Invalid response ("Math extension cannot connect to Restbase.") from server "https://wikimedia.org/api/rest_v1/":): {\displaystyle F_x} , to the steady-state drag force, Failed to parse (SVG (MathML can be enabled via browser plugin): Invalid response ("Math extension cannot connect to Restbase.") from server "https://wikimedia.org/api/rest_v1/":): {\displaystyle F_c} , in wind-tunnel tests is defined as
Opening-force coefficient, Failed to parse (SVG (MathML can be enabled via browser plugin): Invalid response ("Math extension cannot connect to Restbase.") from server "https://wikimedia.org/api/rest_v1/":): {\displaystyle C_x=\frac{F_x}{F_c}} (see Figure 5-43).Failed to parse (SVG (MathML can be enabled via browser plugin): Invalid response ("Math extension cannot connect to Restbase.") from server "https://wikimedia.org/api/rest_v1/":): {\displaystyle C_x} is a constant for a specific parachute type, as shown in Tables 5-1 through 5-5
With the newly defined opening-force coefficient, Failed to parse (SVG (MathML can be enabled via browser plugin): Invalid response ("Math extension cannot connect to Restbase.") from server "https://wikimedia.org/api/rest_v1/":): {\displaystyle C_x} , the equation for the parachute force can be written
Failed to parse (SVG (MathML can be enabled via browser plugin): Invalid response ("Math extension cannot connect to Restbase.") from server "https://wikimedia.org/api/rest_v1/":): {\displaystyle F_x=(C_DS)_p\ q\ C_x\ X_1}
where
Failed to parse (SVG (MathML can be enabled via browser plugin): Invalid response ("Math extension cannot connect to Restbase.") from server "https://wikimedia.org/api/rest_v1/":): {\displaystyle (C_DS)_p} = the drag area of the fully open parachute, Failed to parse (SVG (MathML can be enabled via browser plugin): Invalid response ("Math extension cannot connect to Restbase.") from server "https://wikimedia.org/api/rest_v1/":): {\displaystyle ft^2}
q = the dynamic pressure at line (canopy) stretch, Failed to parse (SVG (MathML can be enabled via browser plugin): Invalid response ("Math extension cannot connect to Restbase.") from server "https://wikimedia.org/api/rest_v1/":): {\displaystyle lb/ft^2}
Failed to parse (SVG (MathML can be enabled via browser plugin): Invalid response ("Math extension cannot connect to Restbase.") from server "https://wikimedia.org/api/rest_v1/":): {\displaystyle C_x} = the opening force coefficient at infinite mass, dimensionless
Failed to parse (SVG (MathML can be enabled via browser plugin): Invalid response ("Math extension cannot connect to Restbase.") from server "https://wikimedia.org/api/rest_v1/":): {\displaystyle X_1} = opening-force-reduction factor, dimensionless.
The force-reduction factor, Failed to parse (SVG (MathML can be enabled via browser plugin): Invalid response ("Math extension cannot connect to Restbase.") from server "https://wikimedia.org/api/rest_v1/":): {\displaystyle X_1} , is 1.0 for a parachute opened at the infinite mass condition; close to 1 for high canopy loading drogue chutes (close to the infinite mass condition); and as low as 0.02 for final descent parachutes with a low canopy loading (finite mass).
Table 5-7 shows the difference in opening forces and Failed to parse (SVG (MathML can be enabled via browser plugin): Invalid response ("Math extension cannot connect to Restbase.") from server "https://wikimedia.org/api/rest_v1/":): {\displaystyle X_1} factor for a 28-foot-diameter parachute opened at 180 KEAS behind an aircraft as a landing deceleration parachute; behind an ordnance device such as a bomb, mine, or torpedo for retardation; and as personnel parachute for an aviator. The difference in the force reduction factor Failed to parse (SVG (MathML can be enabled via browser plugin): Invalid response ("Math extension cannot connect to Restbase.") from server "https://wikimedia.org/api/rest_v1/":): {\displaystyle X_1} for the three applications is surprising. The primary reason for this effect is the difference in velocity decay during the parachute opening process.
Figure 5-45 shows the force-time record of a 15.6-foot-diameter ringslot parachute opened behind a B-47 bomber at a 30,000-foot altitude. This parachute, used as an approach brake for descent from high altitude, has a canopy loading close to infinite mass condition, resulting in an Failed to parse (SVG (MathML can be enabled via browser plugin): Invalid response ("Math extension cannot connect to Restbase.") from server "https://wikimedia.org/api/rest_v1/":): {\displaystyle X_1} , factor of 1.0.

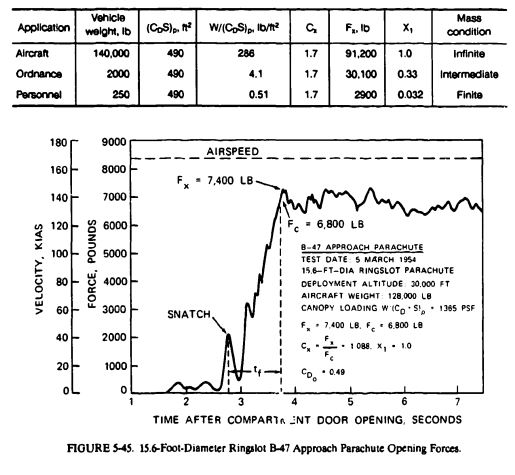
The clean, aerodynamic configuration of the B-47 bomber produced a shallow approach angle, making a point landing difficult. A 15.6-foot-diameter ringslot parachute was used instead of wing brakes or spoilers to increase the drag on approach and thereby steepen the glide angle. At touchdown, a 32-foot-diameter ribbon parachute was deployed as a deceleration parachute side-by-side with the ringslot parachute. Deploying the parachutes at even skirt levels assured successful opening of the second parachute. Note that the aircraft velocity does not decay during parachute inflation.
Figure 5-46 shows the opening process and the opening force versus time for a 29-foot-diameter, guide surface personnel parachute tested at 250 knots at the El Centro, Calif., whirl tower. The difference in the force-versus-time diagram, with the ringslot parachute opened behind the B-47 aircraft, is obvious. The maximum opening force, Failed to parse (SVG (MathML can be enabled via browser plugin): Invalid response ("Math extension cannot connect to Restbase.") from server "https://wikimedia.org/api/rest_v1/":): {\displaystyle F_x} , occurs when the parachute canopy has reached about one-third of its inflated diameter. The force at full open canopy has decreased to about 600 pounds, indicating that parachute velocity during opening has decreased almost to equilibrium velocity. The velocity decay during opening results in an opening-force-reduction factor, Failed to parse (SVG (MathML can be enabled via browser plugin): Invalid response ("Math extension cannot connect to Restbase.") from server "https://wikimedia.org/api/rest_v1/":): {\displaystyle X_1} . of 0.0239.
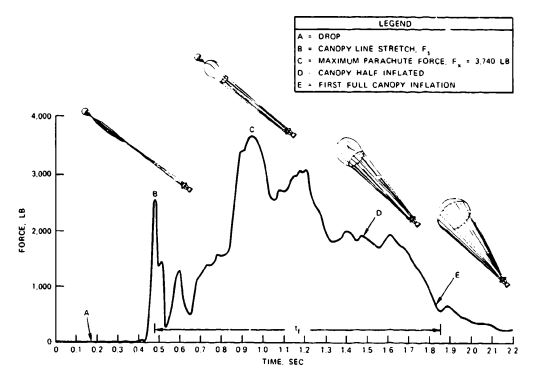
Another important characteristic is the relative size of the snatch force. On high canopy loading parachutes, where the parachute mass is small compared to the mass of the vehicle to be decelerated, the snatch force is small if the deployment system is good, as described in Chapter 6. On low canopy loading parachutes, where the mass of the parachute can be 3 to 7% of the mass to be decelerated, the snatch force can reach or surpass the maximum opening force unless a proper deployment method is used.
All parachute applications fall into distinctive groups of canopy loading, Failed to parse (SVG (MathML can be enabled via browser plugin): Invalid response ("Math extension cannot connect to Restbase.") from server "https://wikimedia.org/api/rest_v1/":): {\displaystyle W/(C_DS)_p} . Canopy loading is equivalent to dynamic pressure at equilibrium velocity and therefore relates to rate of descent. Figure 5-47 shows this relationship.
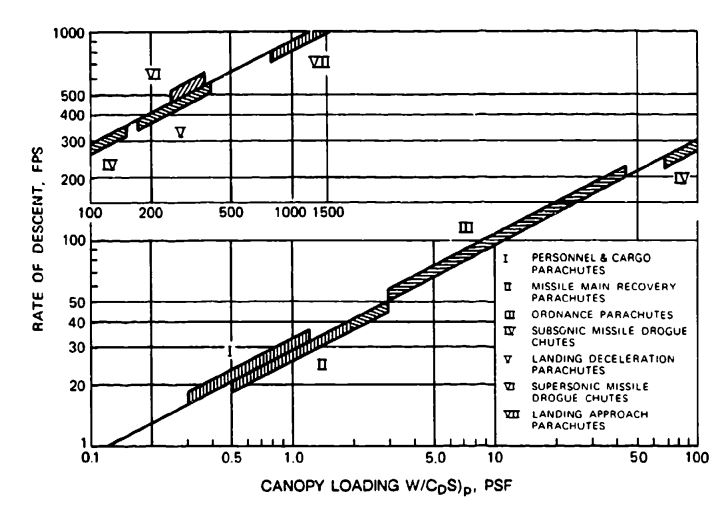
The seven application groups in Figure 5-47 can be combined into three groups in relation to the force-reduction factor, Failed to parse (SVG (MathML can be enabled via browser plugin): Invalid response ("Math extension cannot connect to Restbase.") from server "https://wikimedia.org/api/rest_v1/":): {\displaystyle X_1}
. Groups I and II will have Failed to parse (SVG (MathML can be enabled via browser plugin): Invalid response ("Math extension cannot connect to Restbase.") from server "https://wikimedia.org/api/rest_v1/":): {\displaystyle X_1}
factors in the 0.02- to 0.25-range (personnel and cargo) parachutes. Group III (ordnance) parachutes have Failed to parse (SVG (MathML can be enabled via browser plugin): Invalid response ("Math extension cannot connect to Restbase.") from server "https://wikimedia.org/api/rest_v1/":): {\displaystyle X_1}
factors in the 0.3 to 0.7 range. These parachute groups operate at finite mass conditions. All parachutes in Groups IV to VII have Failed to parse (SVG (MathML can be enabled via browser plugin): Invalid response ("Math extension cannot connect to Restbase.") from server "https://wikimedia.org/api/rest_v1/":): {\displaystyle X_1}
factors close to or equal to 1.0 and operate at infinite mass conditions.
5.4.6 Methods for Calculating Parachute Opening Forces
Three methods for calculating parachute opening forces are discussed in this section. Method I, the Failed to parse (SVG (MathML can be enabled via browser plugin): Invalid response ("Math extension cannot connect to Restbase.") from server "https://wikimedia.org/api/rest_v1/":): {\displaystyle W/(C_DS)_p} method, is fast but should be used for preliminary calculations only. Method 2, the Pflanz method, is mathematically exact and provides good results within certain application limits. Method 3, the previously mentioned computerized force-trajectory-time method, gives good results with no limitations. However, all three methods require knowledge of certain parachute and opening-process characteristics.
Method 1, Failed to parse (SVG (MathML can be enabled via browser plugin): Invalid response ("Math extension cannot connect to Restbase.") from server "https://wikimedia.org/api/rest_v1/":): {\displaystyle W/(C_DS)_p} Method. The equation for the parachute opening force, Failed to parse (SVG (MathML can be enabled via browser plugin): Invalid response ("Math extension cannot connect to Restbase.") from server "https://wikimedia.org/api/rest_v1/":): {\displaystyle F_x} , was defined in section 5.4.5 as
Failed to parse (SVG (MathML can be enabled via browser plugin): Invalid response ("Math extension cannot connect to Restbase.") from server "https://wikimedia.org/api/rest_v1/":): {\displaystyle F_x = (C_DS)_p\ q \ C_x\ X_1}
where
Failed to parse (SVG (MathML can be enabled via browser plugin): Invalid response ("Math extension cannot connect to Restbase.") from server "https://wikimedia.org/api/rest_v1/":): {\displaystyle (C_DS)_p} = the drag area of the full open or reefed parachute, Failed to parse (SVG (MathML can be enabled via browser plugin): Invalid response ("Math extension cannot connect to Restbase.") from server "https://wikimedia.org/api/rest_v1/":): {\displaystyle ft^2}
q = the dynamic pressure at line stretch or disreef, Failed to parse (SVG (MathML can be enabled via browser plugin): Invalid response ("Math extension cannot connect to Restbase.") from server "https://wikimedia.org/api/rest_v1/":): {\displaystyle lb/ft^2}
Failed to parse (SVG (MathML can be enabled via browser plugin): Invalid response ("Math extension cannot connect to Restbase.") from server "https://wikimedia.org/api/rest_v1/":): {\displaystyle C_x} = the opening-force coefficient at infinite mass, dimensionless (Tables 5-1 through 5-5). Do not use Failed to parse (SVG (MathML can be enabled via browser plugin): Invalid response ("Math extension cannot connect to Restbase.") from server "https://wikimedia.org/api/rest_v1/":): {\displaystyle C_x} at low canopy loading
Failed to parse (SVG (MathML can be enabled via browser plugin): Invalid response ("Math extension cannot connect to Restbase.") from server "https://wikimedia.org/api/rest_v1/":): {\displaystyle X_1} = the force-reduction factor (the unknown factor in this equation), dimensionless
For an unreefed parachute, the drag area, Failed to parse (SVG (MathML can be enabled via browser plugin): Invalid response ("Math extension cannot connect to Restbase.") from server "https://wikimedia.org/api/rest_v1/":): {\displaystyle (C_DS)_p} of the full open parachute is used. For a reefed parachute, a preliminary reefed drag area, Failed to parse (SVG (MathML can be enabled via browser plugin): Invalid response ("Math extension cannot connect to Restbase.") from server "https://wikimedia.org/api/rest_v1/":): {\displaystyle (C_DS)_r} , can be calculated from the allowable maximum parachute force, Failed to parse (SVG (MathML can be enabled via browser plugin): Invalid response ("Math extension cannot connect to Restbase.") from server "https://wikimedia.org/api/rest_v1/":): {\displaystyle F_x} , and the dynamic pressure at line stretch:
Failed to parse (SVG (MathML can be enabled via browser plugin): Invalid response ("Math extension cannot connect to Restbase.") from server "https://wikimedia.org/api/rest_v1/":): {\displaystyle (C_DS)_R= \frac{F_x}{q\ C_x\ X_1}}
For this preliminary calculation, an opening-force coefficient, Failed to parse (SVG (MathML can be enabled via browser plugin): Invalid response ("Math extension cannot connect to Restbase.") from server "https://wikimedia.org/api/rest_v1/":): {\displaystyle C_x}
, of 1.0 should be used for the reefed parachute. The force-reduction factor, Failed to parse (SVG (MathML can be enabled via browser plugin): Invalid response ("Math extension cannot connect to Restbase.") from server "https://wikimedia.org/api/rest_v1/":): {\displaystyle X_1}
, can be estimated as 1.0 for reefed drogue chutes and 0.9 for reefed main parachutes.
For the actual force calculations for unreefed parachutes, the force coefficient in Tables 5-1 through 5-5 applies. Reefed parachutes have different opening-force coefficient factors for the reefed and disreefed stages. Figures 5-41 and 5-42 show the drag-area-versus-time diagrams for a reefed ringsail and a reefed triconical parachute. There is no drag overshoot for both parachutes when they open in the reefed stage. Therefore, the opening force coefficient is 1.0. If evaluations from previous tests are not available, a Failed to parse (SVG (MathML can be enabled via browser plugin): Invalid response ("Math extension cannot connect to Restbase.") from server "https://wikimedia.org/api/rest_v1/":): {\displaystyle C_x} , coefficient of 1.1 should be used. For the disreef stage, the force coefficient evaluated from test data should be used, if available; otherwise, Tables 5-1 through 5-5 will provide acceptable data.
For obtaining the opening-force reduction factor, Failed to parse (SVG (MathML can be enabled via browser plugin): Invalid response ("Math extension cannot connect to Restbase.") from server "https://wikimedia.org/api/rest_v1/":): {\displaystyle X_1} , the canopy loading of the full open or the individual reefed stages is calculated and the appropriate X1 factor as a function of canopy loading is found in Figure 5-48.
The amount of parachute force fluctuation in the wake of the forebody must be considered when calculating the opening force of a small drogue chute behind a large forebody. This fluctuation is illustrated in Figure 5-49, which shows the effect of the Apollo space capsule's wake on the opening force of the 16.5-foot-diameter ribbon drogue chute (Reference 5.10).
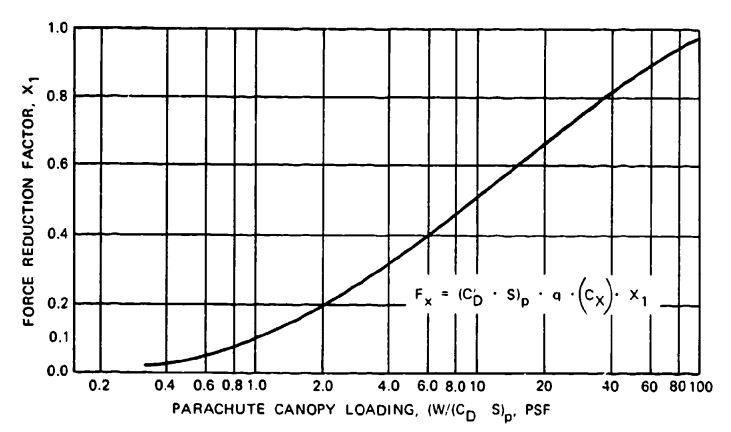
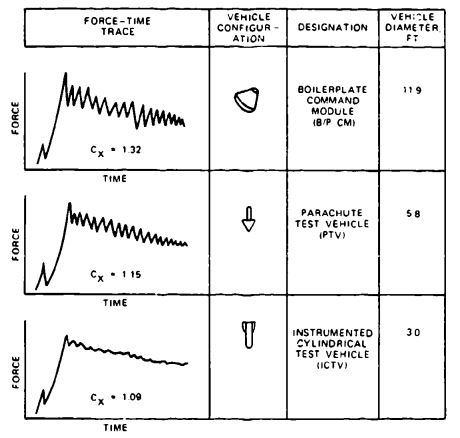
The increase in load fluctuation from the small ICTV to the large-diameter boilerplate command module (B/P CM) is apparent in the increase of the force coefficient, Failed to parse (SVG (MathML can be enabled via browser plugin): Invalid response ("Math extension cannot connect to Restbase.") from server "https://wikimedia.org/api/rest_v1/":): {\displaystyle C_x} , from 1.09 to 1.31. The force coefficient in Figure 5-49 is actually the product Failed to parse (SVG (MathML can be enabled via browser plugin): Invalid response ("Math extension cannot connect to Restbase.") from server "https://wikimedia.org/api/rest_v1/":): {\displaystyle C_x} , times Failed to parse (SVG (MathML can be enabled via browser plugin): Invalid response ("Math extension cannot connect to Restbase.") from server "https://wikimedia.org/api/rest_v1/":): {\displaystyle X_1} , called Failed to parse (SVG (MathML can be enabled via browser plugin): Invalid response ("Math extension cannot connect to Restbase.") from server "https://wikimedia.org/api/rest_v1/":): {\displaystyle C_k} . However, at the canopy loading of the drogue chute, Failed to parse (SVG (MathML can be enabled via browser plugin): Invalid response ("Math extension cannot connect to Restbase.") from server "https://wikimedia.org/api/rest_v1/":): {\displaystyle X_1} will be close to 1.0, approaching the infinite mass condition.
The Failed to parse (SVG (MathML can be enabled via browser plugin): Invalid response ("Math extension cannot connect to Restbase.") from server "https://wikimedia.org/api/rest_v1/":): {\displaystyle X_1} factor can be obtained from drop tests by calculating
Failed to parse (SVG (MathML can be enabled via browser plugin): Invalid response ("Math extension cannot connect to Restbase.") from server "https://wikimedia.org/api/rest_v1/":): {\displaystyle X_1=\frac{F_x}{(C_DS)\ q}}
and then plotting it versus Failed to parse (SVG (MathML can be enabled via browser plugin): Invalid response ("Math extension cannot connect to Restbase.") from server "https://wikimedia.org/api/rest_v1/":): {\displaystyle W/(C_DS)_p} . The data in Figure 5-48 were obtained by this method. The Failed to parse (SVG (MathML can be enabled via browser plugin): Invalid response ("Math extension cannot connect to Restbase.") from server "https://wikimedia.org/api/rest_v1/":): {\displaystyle X_1} factor in Figure 5-48 does not include the effect of altitude. Opening forces of high-canopy-loading parachutes change little with altitude. However, the effect of altitude on low-canopy-loading parachutes, such as personnel parachutes, is considerable. For low-canopy-loading parachutes, the Failed to parse (SVG (MathML can be enabled via browser plugin): Invalid response ("Math extension cannot connect to Restbase.") from server "https://wikimedia.org/api/rest_v1/":): {\displaystyle X_1} , factors should be used only for altitudes below 15,000 feet. Section 5.5 contains a discussion of the altitude effect on parachute forces.
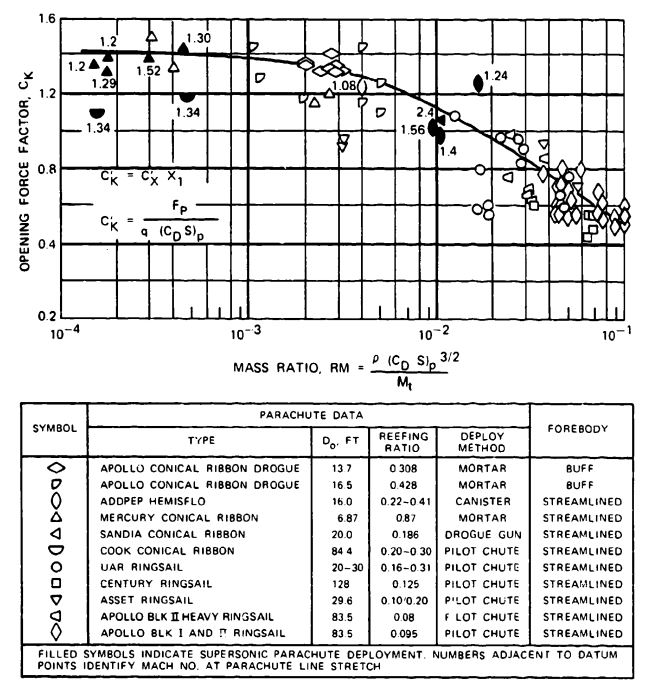
Ewing evaluated and plotted the Failed to parse (SVG (MathML can be enabled via browser plugin): Invalid response ("Math extension cannot connect to Restbase.") from server "https://wikimedia.org/api/rest_v1/":): {\displaystyle C_k=C_xX_1} factor from numerous tests of ringsail parachutes (Reference 5.50).
French recommends plotting a Failed to parse (SVG (MathML can be enabled via browser plugin): Invalid response ("Math extension cannot connect to Restbase.") from server "https://wikimedia.org/api/rest_v1/":): {\displaystyle C_k=C_xX_1} factor versus a mass parameter in the form Failed to parse (SVG (MathML can be enabled via browser plugin): Invalid response ("Math extension cannot connect to Restbase.") from server "https://wikimedia.org/api/rest_v1/":): {\displaystyle D_o^3/m} , where Failed to parse (SVG (MathML can be enabled via browser plugin): Invalid response ("Math extension cannot connect to Restbase.") from server "https://wikimedia.org/api/rest_v1/":): {\displaystyle D_o} is the nominal diameter of the parachute and m is the mass of the vehicle and the parachute assembly (Reference 5.80).
Schilling recommends modifying this mass parameter to the form
Failed to parse (SVG (MathML can be enabled via browser plugin): Invalid response ("Math extension cannot connect to Restbase.") from server "https://wikimedia.org/api/rest_v1/":): {\displaystyle R_m=\frac{\rho(C_DS)_p^{3/2}}{m_t}}
where Failed to parse (SVG (MathML can be enabled via browser plugin): Invalid response ("Math extension cannot connect to Restbase.") from server "https://wikimedia.org/api/rest_v1/":): {\displaystyle m_t} is the total mass of vehicle plus decelerator, Failed to parse (SVG (MathML can be enabled via browser plugin): Invalid response ("Math extension cannot connect to Restbase.") from server "https://wikimedia.org/api/rest_v1/":): {\displaystyle \rho} is the air density, and Failed to parse (SVG (MathML can be enabled via browser plugin): Invalid response ("Math extension cannot connect to Restbase.") from server "https://wikimedia.org/api/rest_v1/":): {\displaystyle (C_DS)_p} is the parachute drag area (Reference 5.81). The value Failed to parse (SVG (MathML can be enabled via browser plugin): Invalid response ("Math extension cannot connect to Restbase.") from server "https://wikimedia.org/api/rest_v1/":): {\displaystyle \rho \cdot (C_DS)_p^{3/2}} represents the volume of the air in and around the parachute canopy and has an obvious relationship to the apparent mass. The altitude effect is now included in plotting Failed to parse (SVG (MathML can be enabled via browser plugin): Invalid response ("Math extension cannot connect to Restbase.") from server "https://wikimedia.org/api/rest_v1/":): {\displaystyle C_k} factors versus this mass parameter, Failed to parse (SVG (MathML can be enabled via browser plugin): Invalid response ("Math extension cannot connect to Restbase.") from server "https://wikimedia.org/api/rest_v1/":): {\displaystyle R_m} . Figure 5-50, taken from a Northrop publication, shows Failed to parse (SVG (MathML can be enabled via browser plugin): Invalid response ("Math extension cannot connect to Restbase.") from server "https://wikimedia.org/api/rest_v1/":): {\displaystyle C_k} factors for reefed and unreefed ribbon and ringslot parachutes plotted versus the mass parameter. These data include supersonic deployment of ribbon parachutes.
Method 2, Pflanz Method. The Pflanz method was developed in Germany during World War II by E. Pflanz in cooperation with the author. It was based on the following concept. A body of known fixed weight and velocity is decelerated along a horizontal flight path by an aerodynamic drag device whose drag area increases from a small value to 100% in a known, mathematically definable form. This method is mathematically exact; however, no Failed to parse (SVG (MathML can be enabled via browser plugin): Invalid response ("Math extension cannot connect to Restbase.") from server "https://wikimedia.org/api/rest_v1/":): {\displaystyle (C_DS)_p} overshoot is included at the start of the reefed or disreefed inflation cycle. Details of this method may be found in References 5.76 and 5.77.
A dimensionless ballistic parameter, A, is formed from known or calculated data
Failed to parse (SVG (MathML can be enabled via browser plugin): Invalid response ("Math extension cannot connect to Restbase.") from server "https://wikimedia.org/api/rest_v1/":): {\displaystyle A= \frac{2W_t}{(C_DS)_p\rho g v_1 t_f}}
where
A = ballistic parameter, dimensionless
Failed to parse (SVG (MathML can be enabled via browser plugin): Invalid response ("Math extension cannot connect to Restbase.") from server "https://wikimedia.org/api/rest_v1/":): {\displaystyle W_t} = system weight, lb
Failed to parse (SVG (MathML can be enabled via browser plugin): Invalid response ("Math extension cannot connect to Restbase.") from server "https://wikimedia.org/api/rest_v1/":): {\displaystyle (C_DS)_p} = parachute drag area, reefed or fully open, Failed to parse (SVG (MathML can be enabled via browser plugin): Invalid response ("Math extension cannot connect to Restbase.") from server "https://wikimedia.org/api/rest_v1/":): {\displaystyle ft^2}
g = acceleration of gravity, Failed to parse (SVG (MathML can be enabled via browser plugin): Invalid response ("Math extension cannot connect to Restbase.") from server "https://wikimedia.org/api/rest_v1/":): {\displaystyle ft/s^2}
Failed to parse (SVG (MathML can be enabled via browser plugin): Invalid response ("Math extension cannot connect to Restbase.") from server "https://wikimedia.org/api/rest_v1/":): {\displaystyle v_1} = velocity at line stretch or start of disreef, ft/s
Failed to parse (SVG (MathML can be enabled via browser plugin): Invalid response ("Math extension cannot connect to Restbase.") from server "https://wikimedia.org/api/rest_v1/":): {\displaystyle \rho} = air density at altitude of parachute inflation, Failed to parse (SVG (MathML can be enabled via browser plugin): Invalid response ("Math extension cannot connect to Restbase.") from server "https://wikimedia.org/api/rest_v1/":): {\displaystyle slug/ft^3}
Failed to parse (SVG (MathML can be enabled via browser plugin): Invalid response ("Math extension cannot connect to Restbase.") from server "https://wikimedia.org/api/rest_v1/":): {\displaystyle t_f} = canopy inflation time
Failed to parse (SVG (MathML can be enabled via browser plugin): Invalid response ("Math extension cannot connect to Restbase.") from server "https://wikimedia.org/api/rest_v1/":): {\displaystyle W_t, q, \rho} are fixed values for each specific application, as is the drag area of the fully open parachute, Failed to parse (SVG (MathML can be enabled via browser plugin): Invalid response ("Math extension cannot connect to Restbase.") from server "https://wikimedia.org/api/rest_v1/":): {\displaystyle (C_DS)_p} . A preliminary drag area of the reefed parachute, Failed to parse (SVG (MathML can be enabled via browser plugin): Invalid response ("Math extension cannot connect to Restbase.") from server "https://wikimedia.org/api/rest_v1/":): {\displaystyle (C_DS)_r} , can be calculated as described in Method 1. The reefed filling time, Failed to parse (SVG (MathML can be enabled via browser plugin): Invalid response ("Math extension cannot connect to Restbase.") from server "https://wikimedia.org/api/rest_v1/":): {\displaystyle t_{f_1}} , and the canopy disreefing time, Failed to parse (SVG (MathML can be enabled via browser plugin): Invalid response ("Math extension cannot connect to Restbase.") from server "https://wikimedia.org/api/rest_v1/":): {\displaystyle t_{f_1}} , are calculated by the method given in section 5.4.3. After calculating the ballistic parameter, A, the force-reduction factor, Failed to parse (SVG (MathML can be enabled via browser plugin): Invalid response ("Math extension cannot connect to Restbase.") from server "https://wikimedia.org/api/rest_v1/":): {\displaystyle X_1} , is obtained from Figure 5-51. However, before determining Failed to parse (SVG (MathML can be enabled via browser plugin): Invalid response ("Math extension cannot connect to Restbase.") from server "https://wikimedia.org/api/rest_v1/":): {\displaystyle X_1} , the shape of the drag area increases versus time must be determined for the selected parachute. This drag-area-versus-time rise is denoted in Figure 5-51 by the letter n. The n = 1 curve is a straight line, typical for ribbon and ringslot parachutes. The concave curve, n = 2 is representative of solid cloth, flat circular, conical, extended skirt, and triconical parachutes described in section 5.4.4. The convex form of Failed to parse (SVG (MathML can be enabled via browser plugin): Invalid response ("Math extension cannot connect to Restbase.") from server "https://wikimedia.org/api/rest_v1/":): {\displaystyle (C_DS)_p} versus time occurs only in the reefed inflation of extended-skirt parachutes. Refer to the comments on the Failed to parse (SVG (MathML can be enabled via browser plugin): Invalid response ("Math extension cannot connect to Restbase.") from server "https://wikimedia.org/api/rest_v1/":): {\displaystyle C_x} factor of Method 1 for low-canopy-Ioading, unreefed parachutes.
The Pflanz report provides extensive information on forces, time of maximum force, and velocity decay versus time during the parachute inflation process for a variety of drag-area-versus-time increases other than those shown in Figure 5-51.
After the force factor, Failed to parse (SVG (MathML can be enabled via browser plugin): Invalid response ("Math extension cannot connect to Restbase.") from server "https://wikimedia.org/api/rest_v1/":): {\displaystyle X_1} , is determined from Figure 5-51, the opening force of the parachute is calculated as it was in Method 1 where
Failed to parse (SVG (MathML can be enabled via browser plugin): Invalid response ("Math extension cannot connect to Restbase.") from server "https://wikimedia.org/api/rest_v1/":): {\displaystyle F_p=(C_DS)_p\ q_1 (C_x)X_1, lb}
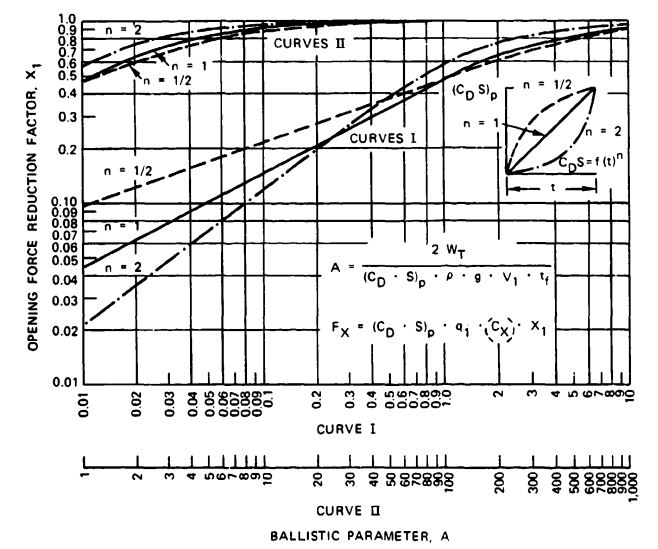
where
Failed to parse (SVG (MathML can be enabled via browser plugin): Invalid response ("Math extension cannot connect to Restbase.") from server "https://wikimedia.org/api/rest_v1/":): {\displaystyle (C_DS)_p} = the drag area of the fully open or reefed parachute
Failed to parse (SVG (MathML can be enabled via browser plugin): Invalid response ("Math extension cannot connect to Restbase.") from server "https://wikimedia.org/api/rest_v1/":): {\displaystyle q_1} = the dynamic pressure at the start of inflation or at disreef
Failed to parse (SVG (MathML can be enabled via browser plugin): Invalid response ("Math extension cannot connect to Restbase.") from server "https://wikimedia.org/api/rest_v1/":): {\displaystyle C_x} = the opening-force coefficient for the reefed or unreefed parachute. To be used only for high canopy loading conditions
Failed to parse (SVG (MathML can be enabled via browser plugin): Invalid response ("Math extension cannot connect to Restbase.") from server "https://wikimedia.org/api/rest_v1/":): {\displaystyle X_1} = the force-reduction factor determined from Figure 5-51
Frequently, a velocity decay occurs between vehicle launch and canopy (line) stretch, Failed to parse (SVG (MathML can be enabled via browser plugin): Invalid response ("Math extension cannot connect to Restbase.") from server "https://wikimedia.org/api/rest_v1/":): {\displaystyle V_1} . This decay can be calculated for deceleration in a horizontal plane
Failed to parse (SVG (MathML can be enabled via browser plugin): Invalid response ("Math extension cannot connect to Restbase.") from server "https://wikimedia.org/api/rest_v1/":): {\displaystyle V_1=\frac{V_o}{1+[\frac{(C_DS)_p\ \rho \ g\ t_f\ V_o}{2W}]}}
where
Failed to parse (SVG (MathML can be enabled via browser plugin): Invalid response ("Math extension cannot connect to Restbase.") from server "https://wikimedia.org/api/rest_v1/":): {\displaystyle V_o} = velocity at the beginning of deceleration. All other notations are similar to those previously used
The second Pflanz report (Reference 5.77) expands on the first report by determining parachute forces and velocity versus time for straight-line trajectories of 30,60, and 90 degrees.
Ludtke, in References 5.83 and 5.84, has somewhat generalized the Pflanz method and has included determination of parachute opening forces from deployment of any trajectory angle.
Method 3, Force-Trajectory-Time Method. The force-trajectory-time method is a computer approach to the parachute opening process. The recovery-system specification for an air vehicle, drone, missile, or aircrew escape system normally defines the starting and ending conditions of the recovery cycle, including weight of the vehicle, starting altitude. velocity, vehicle attitude; and for final recovery or landing, the specification defines the rate of descent at landing and the oscillation limitation. The maximum allowable parachute force is frequently expressed in g as a multiple of the vehicle weight. A typical requirement limits the parachute opening force to 3 to 5g, necessitating a multiple-stage recovery system consistingof a reefed drogue chute and one or more reefed main parachutes.
These conditions require optimization of the total recovery cycle for minimum recovery time, altitude, and range within the allowable parachute force restraints. The computer, with its multiple-run capability that permits many variations in staging, timing, and altitude, is the ideal tool to accomplish this task.
A force-trajectory program best meets the above requirements for calculating the vehicle trajectory and deceleration as well as parachute forces as a function of time. The basic approach is somewhat similar to the Pflanz method. A drag-area-versus-time profile is formed for the total system vehicle plus decelerator. Multiple computer runs are made using the trajectory equations in section 5.4.1. The typical drag area for a main parachute-vehicle system is shown in Figure 5-52. This profile is used in Chapter 7 for dimensioning the main parachute assembly of a reconnaissance drone. Items that must be preselected are the drag area of the main descent parachute(s). the transfer velocity from the drogue chute to the main parachute(s); the filling times for the various parachute stages, reefed and disreefed; and a preliminary staging-timing sequence. The computer run will immediately determine whether the timing and staging are too short, too long, or correct for the force and altitude limitations.
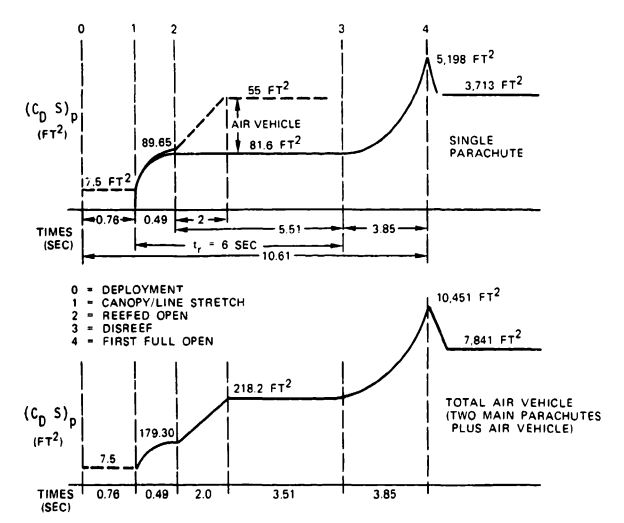
In addition to adjusting for force and altitude requirements, the computer program can easily investigate the effect of changing canopy fill time and slope of the drag-area-versus-time profile on parachute forces. If test data are available, the program can be fine-tuned to a high degree. It is even possible to include the snatch force in the form of a drag-area profile. A special computer program for calculating the deployment cycle and the snatch force is described in Reference 5.86. This program may be extended to include filling-time calculations by introducing the fill distance rather than the fill-time concept.
Figure 5-52 profiles the parachute drag-area-versus-time profile for a 4800-pound reconnaissance drone using a 7.2-foot-diameter conical ribbon drogue chute for high-speed deceleration, and two 72.8-foot-diameter conical, full-extended-skirt parachutes for final recovery. The parachutes are used in conjunction with air bags for impact attenuation. The two main parachutes are deployed at altitudes up to 7000 feet in a vertical vehicle attitude after descending from higher altitude on the drogue chute. Maximum deployment velocity for the main parachute is 375 ft/s. This deployment condition assumes an emergency where recovery is initiated at high speed and high altitude. Normal recovery after mission completion will begin from a horizontal vehicle attitude at 2000 feet above ground and with a velocity below 375 ft/s, bypassing the drogue-chute-deceleration phase.
The upper part of Figure 5-52 shows the drag-area profile for a single main parachute. The drogue chute is disconnected at point zero, and main parachute deployment is initiated. During this time, the vehicle will accelerate while in a vertical attitude or decelerate while in a horizontal attitude. At point 1, canopy and suspension lines are stretched, inflation in the reefed stage begins, and the reefing cutters are initiated for a preselected reefing time. At point 2, the parachute is fully open in the reefed position; disreef begins at point 3. At this time, the pull of the main parachute, which is attached at the vehicle center of gravity with a V-riser for horizontal landing, may cause the vehicle, previously descending on the drogue chute in a vertical attitude, to change to a 90-degree attitude. A 90-degree attitude provides additional drag for deceleration of the vehicle, as indicated by the dotted line. The drag-area overshoot after full parachute inflation depends on the type of parachute used and its reefing conditions.
The lower drag-area curve in Figure 5-52 represents the total system: two main parachutes and the air vehicle. The individual parachute force is half the total calculated force if both parachutes open simultaneously and uniformly. Fast-opening parachutes often create a lead-lag chute condition. Reference 5.78 describes the calculation of opening forces for this condition.
5.4.7 Typical Parachute Opening-Force and Opening-Time Diagrams
Figure 5-53 compares opening forces versus velocity for the standard 28-foot-diameter personnel parachute; the aeroconical parachute used in the Martin-Baker Mark-10 ejection seat; the Irving-developed automatic inflation modulation (AIM) parachute; and the reefed, 28-foot-diameter personnel parachute used for the McDonnell-Douglas ACES II ejection seat.
Figure 5-54 documents the effect of a good deployment system, comparing snatch forces, Failed to parse (SVG (MathML can be enabled via browser plugin): Invalid response ("Math extension cannot connect to Restbase.") from server "https://wikimedia.org/api/rest_v1/":): {\displaystyle F_s} , and opening forces, Failed to parse (SVG (MathML can be enabled via browser plugin): Invalid response ("Math extension cannot connect to Restbase.") from server "https://wikimedia.org/api/rest_v1/":): {\displaystyle F_x} , for the standard 28-foot-diameter personnel parachute. Parachutes without quarter deployment bags (subscript 1) and with quarter deployment bags (subscript 2) are represented. The snatch force of the parachute without a deployment bag varies excessively and exceeds the opening forces. Use of the quarter deployment bag decreases the magnitude and the wide spread of the snatch force. The average opening force, Failed to parse (SVG (MathML can be enabled via browser plugin): Invalid response ("Math extension cannot connect to Restbase.") from server "https://wikimedia.org/api/rest_v1/":): {\displaystyle F_x} , is almost equal for both deployment systems (Reference 5.94).
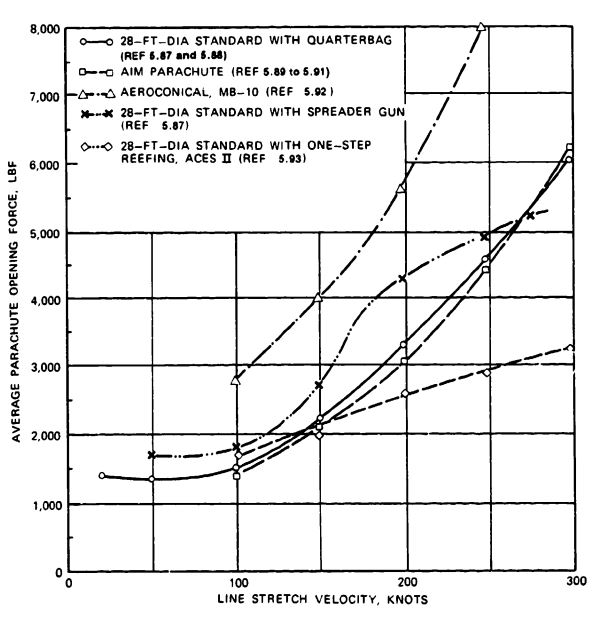
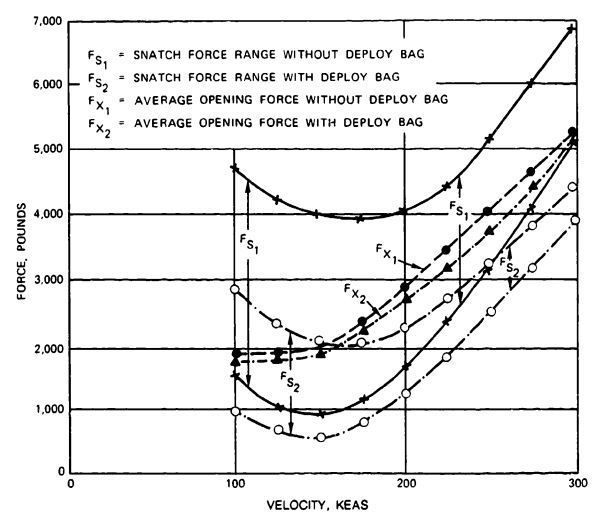
Many methods have been investigated to decrease the parachute opening time, defined as the time from pack opening to first full open canopy. Figure 5-55 compares the opening time of the standard 28-foot-diameter personnel parachute with those of a 28-foot-diameter parachute equipped with pull-down vent lines (PDVL) and of a 28-foot-diameter personnel parachute equipped with a ballistic spreader gun (Reference 5.95). Both modified versions show shorter opening times in the 100 to 300-ft/s velocity range.
Changes that are advantageous in one area frequently result in deficiencies in another. In the case of the PDVL and the spreader gun, the changes result in higher snatch forces.
The force characteristics of reefed parachutes are shown in Figure 5-56, which plots the reefed and disreefed opening forces versus the opening velocity of a single, 88-foot-diameter Apollo Block I spacecraft main parachute.
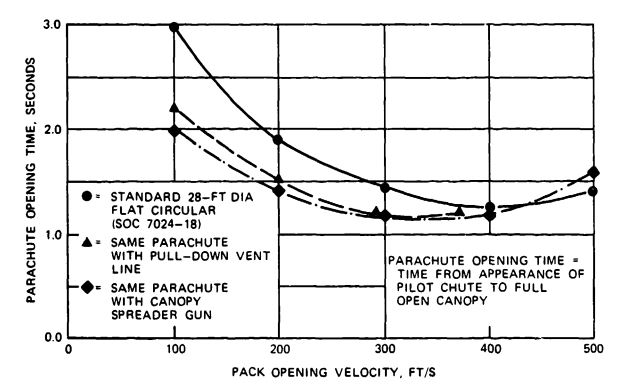
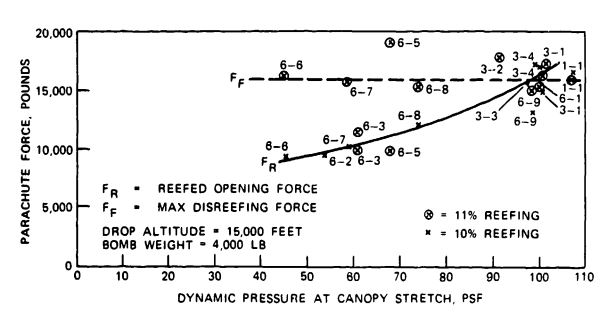
The reefed opening force, Failed to parse (SVG (MathML can be enabled via browser plugin): Invalid response ("Math extension cannot connect to Restbase.") from server "https://wikimedia.org/api/rest_v1/":): {\displaystyle F_r} , increases with velocity, whereas the disreefed force, Failed to parse (SVG (MathML can be enabled via browser plugin): Invalid response ("Math extension cannot connect to Restbase.") from server "https://wikimedia.org/api/rest_v1/":): {\displaystyle F_f} , remains constant, indicating that the reefing time is sufficiently long for the reefed parachute to reach its terminal velocity before disreef. Both force lines should meet at the point of maximum required velocity to give the best force and stress balance and, in return, the minimum-weight parachute assembly. The diagram illustrates another important point: if overload tests are required to demonstrate a margin of safety in the parachute design, only the reefed stage is overload-tested. Even in higher-velocity tests, the reefed parachute would probably reach its final velocity and the disreefed force would not increase.
This situation raises the question of how to conduct overload tests. The reefed parachute stage can be tested by increasing the test velocity to the desired level. The disreefed stage can be tested either by decreasing the reefing ratio of the reefed stage or by increasing the weight of the test vehicle. Both measures will increase velocity before disreef. For the Apollo program's extensive overload testing, the overweight method was selected because it did not change the end-item configuration of the parachute assembly. Three levels of testing were conducted on the Apollo parachute system. Level I used two drogue and three main parachutes to test the parachute forces expected at a normal landing after mission completion. Level II demonstrated the maximum design load occurring in a high-altitude abort case, with only one drogue and two main parachutes operating to a specification requirement. Level III demonstrated an overload capability of 1.35 against maximum design load. Figure 5-57 shows tests conducted on a single reefed drogue chute and a single main parachute reefed in two steps.
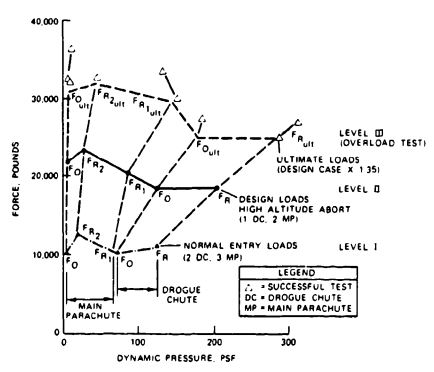
A recommended nomenclature for the parachute opening process is shown in Figure 5-58. Uniform definition of the various opening phases is important in verbal and written communication, especially in reports, so that the performances of different types of parachutes can be compared. Many reports fail to properly define filling time, deployment time, and other times essential for comparing opening characteristics.
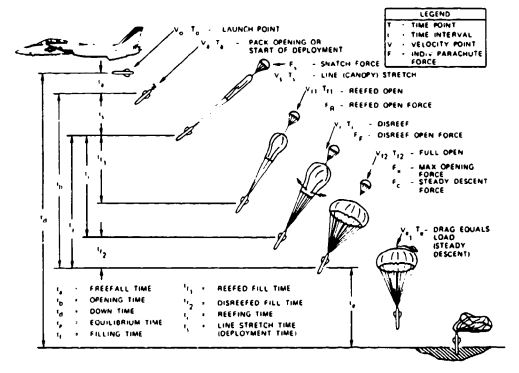
5.5 ALTITUDE AND CANOPY-POROSITY EFFECTS
5.5.1 Altitude Effects
In 1944 the U.S. Army Air Corps conducted tests with five types of silk and nylon personnel parachutes dropped at indicated air speeds of 115 mph - the equilibrium velocity of 200-pound torso dummy-and altitudes of 7000, 15,000, 26,000, and 40,000 feet. To the great surprise of the technical community, the parachute opening forces at 40,000 feet were about four times greater than the forces measured at 7000 feet, even though all parachutes were opened at the same dynamic pressure (indicated air speed). A second surprise was that nylon parachutes had considerably lower opening forces than the silk parachutes that were in extensive use at that time. Figure 5-59 shows the results of these tests (Reference 5.96).
The explanation for this force increases with altitude is that the true velocity is twice as high at 40,000 feet than at sea level for parachutes dropped at constant indicated air speed.
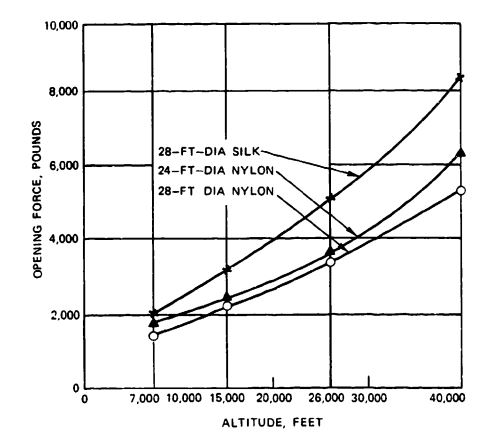
Therefore, the kinetic energy to be absorbed during the inflation process is four times as high. In addition, the filling time of the canopy is only half as long at 40,000 feet as at sea level because of the 100-percent-higher true velocity. The higher forces on the parachutes manufactured from silk are explained by the higher elongation of nylon material. The higher forces on the 24-foot-diameter parachutes were caused by a slightly different design and the resultant shorter filling times.
In the 1950s the Air Force repeated these tests at altitudes up to 20,000 feet. Tests included the Navy 26-foot-diameter conical, and the 35-foot-diameter T-10 extended-skirt parachutes used by paratroopers (Reference 5.97). In addition, high-altitude tests were performed on a reefed, 67-foot-diameter, extended-skirt parachute used as the main descent parachute for the Teledyne-Ryan Q-2 target drone (Reference 5.98). The test results are plotted in Figure 5-60. The opening forces of the four personnel parachutes increased with altitude as did the opening forces in the 1944 tests. The opening forces of the 35-foot-diameter T-10 extended-skirt parachute are considerably lower than the opening forces of the flat circular and conical parachutes. The tests with the reefed 67.3-foot-diameter extended-skirt parachute indicate that the reefed opening forces increase at a lesser rate with altitude than the disreefing forces because of the higher canopy loading of the reefed parachute (see section 5.4.5).
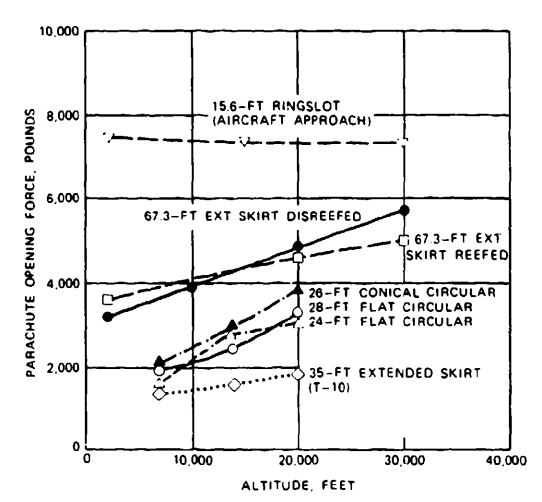
Parachute opening forces produced no force increase with altitude in tests conducted by the U.S. Air Force at Wright Field on the 15.6-foot-diameter ringslot parachute that was used as the approach brake for the B-47 bomber. Test results are shown in Figure 5-61 and plotted in the upper curve in Figure 5-60.
The primary difference in the force increases with altitude - a strong increase in the personnel parachutes, a medium increase in the reefed Q-2 drone parachute, and no increase in the B-47 approach parachute-is based on the canopy loading differences of the various parachutes. The high-canopy-loading B-47 parachute experiences no velocity decrease during parachute inflation at altitudes of either 2000 or 30,000 feet. The low canopy loading personnel parachutes experience a strong velocity decrease during opening at low altitude and a lesser velocity decrease during opening at altitude, resulting in a rapid force increase with altitude. The medium canopy loading, reefed Q-2 drone descent parachute has only a moderate force increase with altitude. The difference in opening force with altitude for parachutes with various canopy loadings is explained in Figure 5-51, where the force reduction factor, Failed to parse (SVG (MathML can be enabled via browser plugin): Invalid response ("Math extension cannot connect to Restbase.") from server "https://wikimedia.org/api/rest_v1/":): {\displaystyle X_1} , is plotted as a function of the ballistic parameter, A. The ballistic parameter includes the density, Failed to parse (SVG (MathML can be enabled via browser plugin): Invalid response ("Math extension cannot connect to Restbase.") from server "https://wikimedia.org/api/rest_v1/":): {\displaystyle \rho} ; the true velocity at parachute line stretch, Failed to parse (SVG (MathML can be enabled via browser plugin): Invalid response ("Math extension cannot connect to Restbase.") from server "https://wikimedia.org/api/rest_v1/":): {\displaystyle V_o} ; and the canopy filling time, Failed to parse (SVG (MathML can be enabled via browser plugin): Invalid response ("Math extension cannot connect to Restbase.") from server "https://wikimedia.org/api/rest_v1/":): {\displaystyle t_f} . All three values change with altitude. The low canopy loading personnel parachutes have ballistic parameter values in the 0.02 to 0.15 range, resulting in opening-force reduction factors approximately four to five times as high at 40,000 feet than at low altitude. The ballistic parameter value of the high canopy loading B-47 approach parachute is in the 200 to 1000 range, with little change in the resultant force reduction factor, Failed to parse (SVG (MathML can be enabled via browser plugin): Invalid response ("Math extension cannot connect to Restbase.") from server "https://wikimedia.org/api/rest_v1/":): {\displaystyle X_1} . The reefed stage of the Q-2 main descent parachute has ballistic parameter value in the 3 to 10 range, producing only a small change in the force reduction factor.
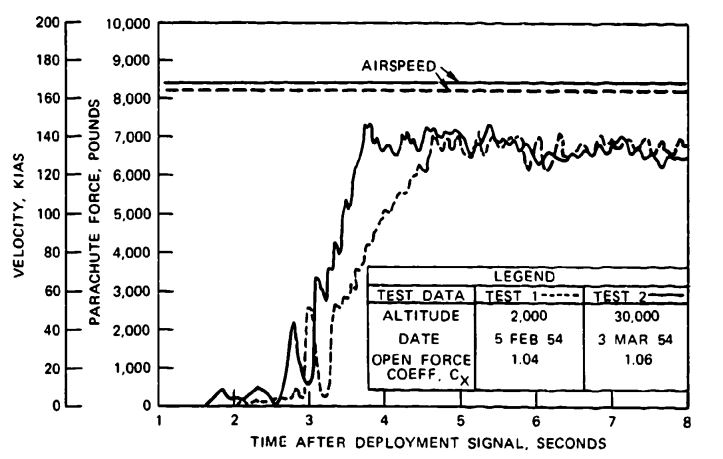
The canopy loading of the parachutes discussed in this analysis and plotted in Figures 5-60 and 5-61 are listed in Table 5-8.
References 5.99 and 5.100 discuss the general application of parachutes for high-altitude recovery and retardation, including the problem of aerodynamic heating and the effect of low canopy loading parachutes deployed after re-entry at high altitudes. In the late 1960s, NASA conducted an extensive program to develop a parachute system for landing the Viking spacecraft on Mars. This Planetary Parachute Entry Program (PPEP) included parachute tests at altitudes up to 139,000 feet and velocities in excess of Mach 3. The test results are summarized in Reference 5.101.
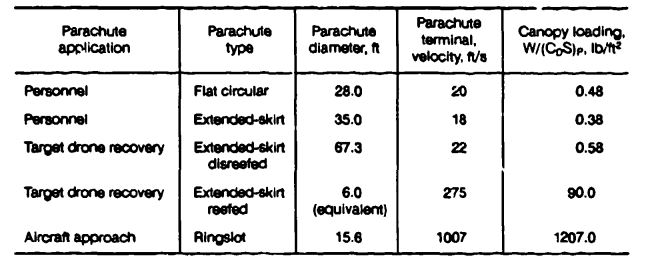
5.5.2 Porosity Effects
The porosity of parachute canopies influences parachute characteristics and parachute performance. For parachute canopies manufactured from solid fabric, the porosity is defined as the airflow through the canopy cloth in Failed to parse (SVG (MathML can be enabled via browser plugin): Invalid response ("Math extension cannot connect to Restbase.") from server "https://wikimedia.org/api/rest_v1/":): {\displaystyle ft^3/ft^2/min} , at a 1/2-inch water pressure. For slotted canopies such as ribbon, ringslot, and ringsail parachutes, porosity is defined in percent as the ratio of all open areas to the total canopy area. Most personnel parachutes and main descent parachutes for air vehicles, airdrop of equipment, and ordnance retardation use materials with porosities from 80 to 150 Failed to parse (SVG (MathML can be enabled via browser plugin): Invalid response ("Math extension cannot connect to Restbase.") from server "https://wikimedia.org/api/rest_v1/":): {\displaystyle ft^3/ft^2/min} . Gliding parachutes of the parawing. sailwing. and parafoil type use materials from 0 to 5 Failed to parse (SVG (MathML can be enabled via browser plugin): Invalid response ("Math extension cannot connect to Restbase.") from server "https://wikimedia.org/api/rest_v1/":): {\displaystyle ft^3/ft^2/min,} , practically imporous. Slotted parachutes use geometric porosities in the 10 to 35% range.
Porosity affects parachute drag, stability, and opening forces. Parachute drag, opening forces, and oscillation decrease with increasing porosity. The decrease in oscillation and forces is a desirable characteristic but the decrease in drag is generally undesirable.
Figure 5-62, taken from Reference 2.1, plots the drag coefficients as a function of porosity for different parachute types. A cloth porosity of 27.4 Failed to parse (SVG (MathML can be enabled via browser plugin): Invalid response ("Math extension cannot connect to Restbase.") from server "https://wikimedia.org/api/rest_v1/":): {\displaystyle ft^3/ft^2/min,} , at 1/2-inch water pressure is equivalent to 1% geometric porosity; this equivalency allows comparison of solid cloth parachutes and slotted parachutes. These data indicate a relationship among all parachutes. If the geometric porosity of a ribbon parachute is lowered to about 5% - the porosity of a flat circular, solid textile parachute-the ribbon parachute obtains the same drag coefficient, Failed to parse (SVG (MathML can be enabled via browser plugin): Invalid response ("Math extension cannot connect to Restbase.") from server "https://wikimedia.org/api/rest_v1/":): {\displaystyle C_{D_o}} , as the flat circular parachute; however, its stability decreases. This is demonstrated in Figure 5-63 by the drag coefficient increase and stability decrease of 3.5-foot-diameter flat and conical ribbon parachutes. The data were summarized from German and Wright Field wind-tunnel tests. A total porosity of 35% is required to obtain zero oscillation for a 3.5-foot-diameter ribbon parachute. Larger parachutes need a lower porosity to maintain proper inflation, zero oscillation, and the desired drag coefficient. The relationship of porosity versus diameter for maintaining proper performance for ribbon parachutes is discussed in Chapter 6.
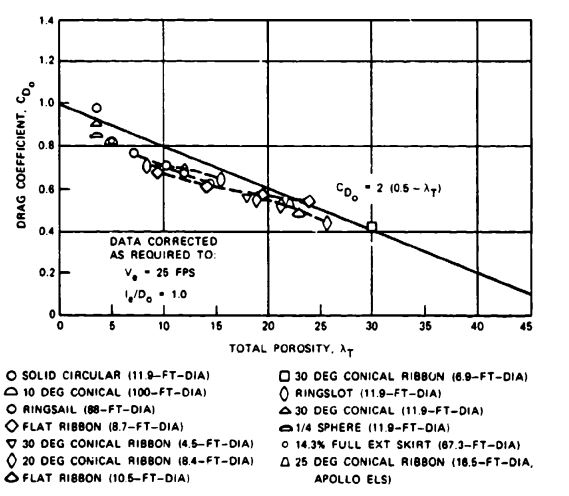
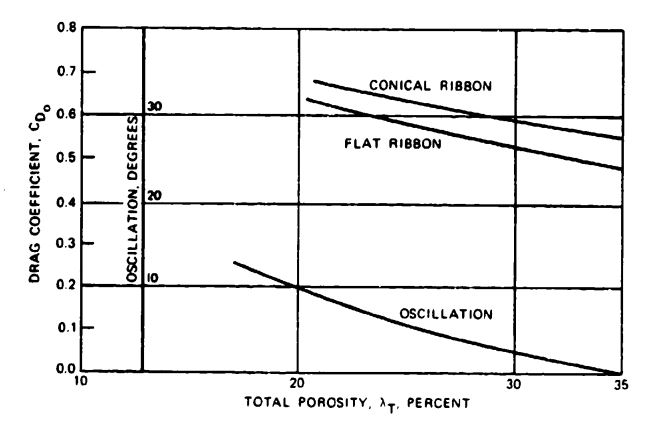
The effect of porosity on the opening-force coefficient, Failed to parse (SVG (MathML can be enabled via browser plugin): Invalid response ("Math extension cannot connect to Restbase.") from server "https://wikimedia.org/api/rest_v1/":): {\displaystyle C_x}
, is demonstrated in Figure 5-64. The data for the ribbon parachute were obtained by the Sandia National Laboratories in wind-tunnel tests (Reference 5.102). The author has supplemented the data range by plotting the opening-force coefficient value for circular solid textile parachutes and has extended the curve to include the range of parachutes manufactured from almost-zero-porosity material. This family of hi-glide parachutes includes the Rogallo parawing and the ram-air-inflated Jalbert parafoil. These parachutes have an opening-force coefficient of 2.5 to 2.8 (see section 5.9).
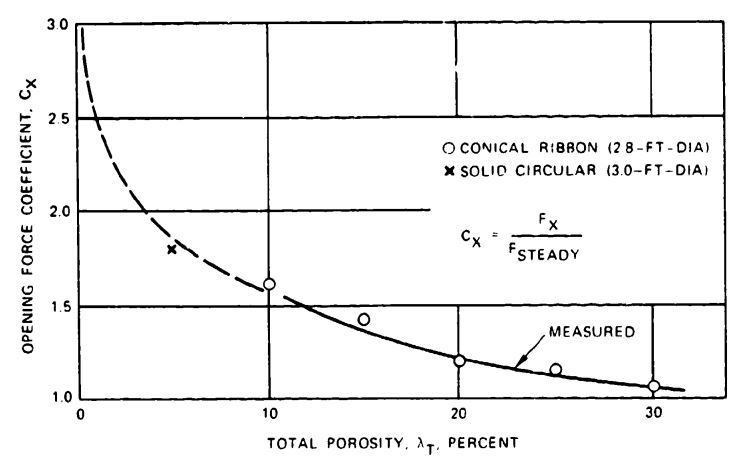
Figure 5-65 shows opening-force coefficient as a function of cloth permeability (porosity) for cross parachutes, as measured by the Naval Ordnance Laboratory (Reference 5.103). In the primary porosity range of 80 to 150 Failed to parse (SVG (MathML can be enabled via browser plugin): Invalid response ("Math extension cannot connect to Restbase.") from server "https://wikimedia.org/api/rest_v1/":): {\displaystyle ft^3/ft^2/min} a force coefficient of 1.1 compares well with ribbon and ringslot parachutes which have a Failed to parse (SVG (MathML can be enabled via browser plugin): Invalid response ("Math extension cannot connect to Restbase.") from server "https://wikimedia.org/api/rest_v1/":): {\displaystyle C_x} of 1.05 to 1.1.
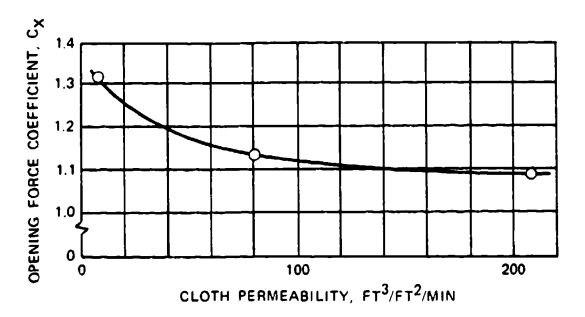
5.6 PARACHUTE REEFING
5.6.1 General Description and Application
Parachute reefing permits the incremental opening of a parachute canopy or restrains the parachute canopy from full inflation or overinflation. Reefing serves to
1. Limit the parachute opening forces to a predetermined value through successive steps of parachute opening, called reefing steps, at predetermined time intervals.
2. Obtain a temporarily high rate of descent. Reefing the parachute to a low drag area permits a more accurate drop from high altitude. Low-impact velocity is then obtained by disreefing the parachute shortly before ground impact.
3. Allow deployment of aircraft landing deceleration parachutes during approach for landing approach control. Disreefing the parachute at touchdown provides a powerful landing brake.
4. Increase parachute stability by a slight amount of fixed reefing.
5. Provide an overinflation control line (OC line) that lets the parachute open fully but prevents overinflation. The OC line decreases the parachute opening force by limiting the force overshoot at final parachute inflation.
Parachute reefing was developed in Germany during World War II, where many reefing methods were investigated. The parachute was restrained from opening fully by placing a line around the canopy, the canopy skirt, and the suspension lines; by pulling down the vent of the parachute; and by releasing the parachute canopy only partially from the container or deployment bag. The skirt reefing method evolved as the most practical solution and is used in much the same form today (Reference 5.104).
Another investigation of various reefing methods was conducted in 1960 in Great Britain (Reference 5.105). Again, the skirt reefing method, called the rigging point reefing in Great Britain, proved to be the most practical system. Several attempts to develop other reefing methods were made. Two methods, vent reefing and slider reefing, have been used in some designs.
Reefing a parachute for use in a parachute recovery system starts with analytical determination of the various drag-area stages and the required timing steps. The analysis is best accomplished in computer runs. These computer runs determine the number of reefing stages; the timing of the stages; and the velocity, altitude, and trajectory increments based on maximum allowable parachute force, parachute force balance in the reefing stages, minimum recovery altitude, and other related requirements (Reference 5.106).
Four reefing methods are discussed in the following subsections.
5.6.2 Skirt Reefing
Skirt reefing, illustrated in Figure 5-66, is the most common reefing method.
Reefing rings are attached to the canopy skirt on the inside of the canopy at the connection point of each suspension line. The reefing line, a continuous line that restricts the opening of the canopy, is guided through the reefing rings and several reefing-line cutters. Each cutter contains a pyro-time train and a cutter knife and is initiated at canopy stretch by pull cords attached to the suspension lines or to the canopy. After a preselected time, the cutter fires and the knife severs the reefing line, allowing the parachute canopy to open fully or enter the next reefing stage.
The length of the reefing line is determined by the required reduction in parachute drag area, called reefing ratio. The required reefing ratio is obtained by proper selection of the reefing-line length. For design purposes, the reefing-line ratio is determined by relating the reefing-line length to the reefing-line length of a fully open parachute. In practice, the reefing-line ratio is defined as the ratio of the reefing-line circle diameter to the nominal diameter of the parachute. Section 5.6.7 gives, for various parachutes. the required reefing-line ratios as a function of the required drag area (reefing ratio). Section 6.5 contains details for proper dimensioning and installation of the reefing system.
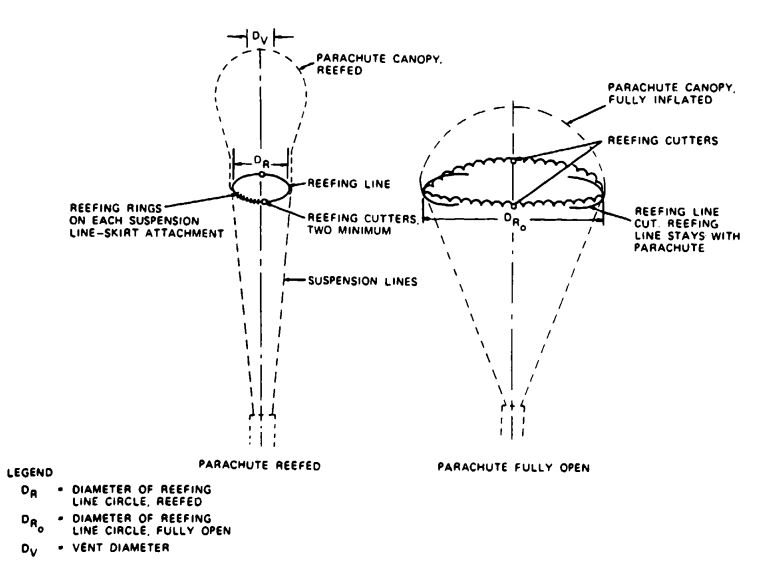
When designing a skirt-reefing system, the designer must
1. Define the length of the reefing line as the installed length.
2. Determine the forces in the reefing line and the resultant forces in the reefing system (see section 5.6.7).
3. Ensure that radial forces created by the forces in the reefing line are properly defined and that the reefing system does not overstress the parachute canopy.
4. Ensure that the vent diameter of the canopy, Failed to parse (SVG (MathML can be enabled via browser plugin): Invalid response ("Math extension cannot connect to Restbase.") from server "https://wikimedia.org/api/rest_v1/":): {\displaystyle D_v} , is smaller than the diameter of the reefing line circle, Failed to parse (SVG (MathML can be enabled via browser plugin): Invalid response ("Math extension cannot connect to Restbase.") from server "https://wikimedia.org/api/rest_v1/":): {\displaystyle D_R} (Figure 5-66). Reefing cutters with electronically controlled time delays have been dr. eloped by the Sandia National Laboratories. Actuating reefing cutters with RF signal from the command module was investigated by Northrop during the Apollo program. Both methods are discussed in section 6.5.
5.6.3 Skirt Reefing with Control line
Skirt reefing with control line is illustrated in Figure 5.67. A two-section reefing line is attached to the canopy skirt at points A, guided around one-quarter of the skirt and out of the canopy at points B to a confluence point, C. returning the same way but around the adjacent quarter of the canopy. A second reefing line is run similarly around the second half of the canopy, and is connected with the first line at point C. The reefing system must allow full opening of the canopy. Pulling the control line toward the confluence point of the suspension lines reefs the canopy, paying out the control line disreefs it.
This method has been used for manually disreefing aircraft landing deceleration parachutes that were deployed reefed on landing approach and disreefed at touchdown.
This method was also investigated for continuous disreefing of parachutes. A disreefing device controlled the payout of the control line by using the force in one suspension line as a control sensor.
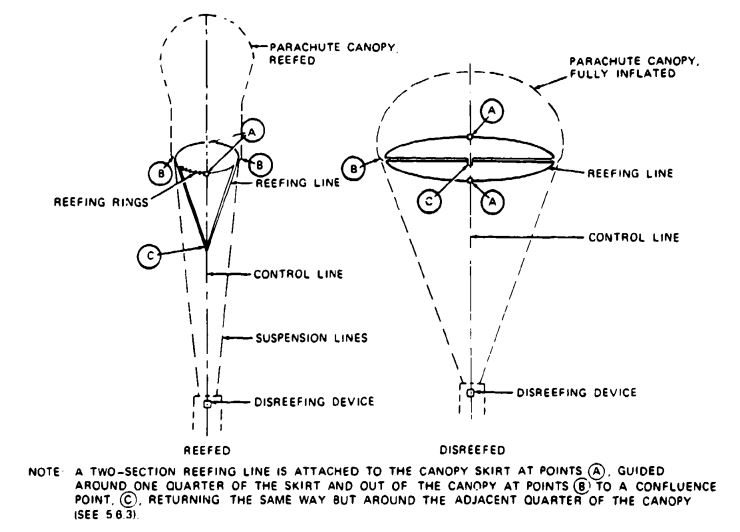
5.6.4 Vent Reefing
Vent reefing is illustrated in Figure 5-68. A line is attached to the center of the parachute vent. Pulling the vent line down toward the confluence point of the suspension line deforms the canopy. Pulling to about the level of the canopy skirt increases the inflated diameter and concurrently increases the drag coefficient, Failed to parse (SVG (MathML can be enabled via browser plugin): Invalid response ("Math extension cannot connect to Restbase.") from server "https://wikimedia.org/api/rest_v1/":): {\displaystyle C_{D_o}} , by about 30%. Continuing the downward pull decreases the canopy diameter and its drag area, creating a reefing condition. Extreme pull on the vent line may cause the suspension lines to wrap over the canopy. The increase in drag created by partial pull of the vent line is used in airfoil and annular parachutes for obtaining a high-drag canopy configuration. Vent reefing has been used for several special applications. Wind-tunnel and aircraft tow tests conducted with this configuration indicate a minimum useful reefing ratio of about 10% of the full-open drag area. Figure 5-69 shows total parachute, vent-line, and suspension-line forces of a vent-reefed parachute as a function of the vent-line retraction.
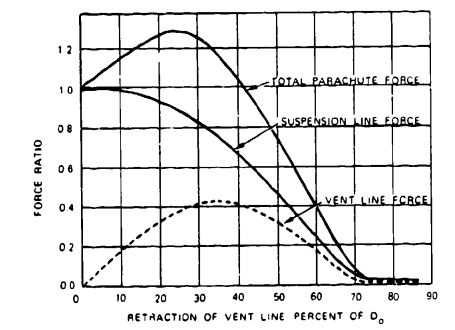
5.6.5 Slider Reefing
Slider reefing is shown in Figure 5-70. A slider, a square piece of cloth with grommets on each comer, is inserted in the center of the suspension lines. The suspension lines, bunched into four groups, pass through the grommets. During parachute packing, the slider is moved up to the parachute skirt. At initial deployment, the slider keeps the canopy closed and prevents a high snatch force. The spreading action of the inflating canopy forces the slider down the suspension lines, delaying and controlling canopy inflation. This method is used extensively on ram-air-inflated gliding parachutes used by sport parachutists.
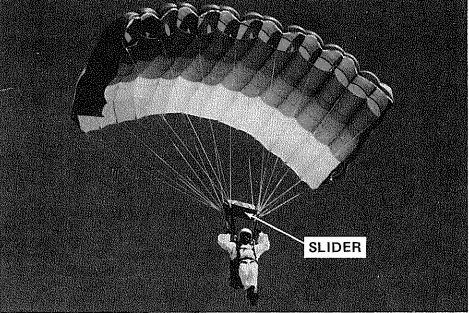
A similar system, Schade ring reefing, was developed and used during World War II and retested in El Centro in 1953 (Reference 5.107).
5.6.6 Continuous Disreefing
Many attempts have been made to develop a reefing system where the opening of the parachute canopy is governed by a preselected force-time diagram. This approach has been called "continuous disreefing" in the literature. One of these investigations is described in Reference 5.108. However, none of these attempts has, so far, resulted in a practical solution.
5.6.7 Drag-Area (Reefing) Ratio Versus Reefing-Line-Length Ratio
Most reefing systems use an incremental opening of the parachute canopy to control the opening process. Knowledge of the required length of the reefing line is mandatory for designing the reefing system.
The drag-area decrease in relation to the decrease in the lengths of the reefing line has been determined in numerous wind-tunnel, aircraft tow, and freefall drop tests (Reference 5.109). Until 1960. the drag-area ratio was called the reefing ratio (Reference 5.104). When the parachute landing systems for the Mercury, Gemini, and Apollo spacecraft were designed, NASA called the reefing-line ratio the reefing ratio (References 2.1 and 5.79). This book, the Parachute Recovery Systems Design Manual, returns to the original definition, calling the drag-area ratio the reefing ratio. Figures 5-71 through 5-73 show the reefing ratio, Failed to parse (SVG (MathML can be enabled via browser plugin): Invalid response ("Math extension cannot connect to Restbase.") from server "https://wikimedia.org/api/rest_v1/":): {\displaystyle \epsilon} (drag-area ratio), versus the reefing-line ratio, Failed to parse (SVG (MathML can be enabled via browser plugin): Invalid response ("Math extension cannot connect to Restbase.") from server "https://wikimedia.org/api/rest_v1/":): {\displaystyle \tau} , for the most commonly used parachutes. These figures are taken from Reference 5.110, which contains a wealth of data on reefing-line versus reefing ratios for a variety of parachutes.
High canopy loading drogue and aircraft parachutes are generally reefed to about 30 to 60% of the full open drag area. Large main recovery parachutes, especially when two-stage reefing is required, must be reefed down to 2 to 5% of the full open drag area. This has been accomplished with circular solid textile and large ringsail parachutes.
In the early 1950s, the author conducted tests at El Centro with a standard 28-foot-diameter, flat circular parachute to determine the minimum obtainable drag area. A parachute without reefing, but with the suspension lines tied together at the skirt, had approximately 2% of the fully open drag area, the canopy descended vertically in a snake-like motion. A parachute with reefing rings and with the reefing line tied ring-to-ring had a 2.5% drag area, resulting in a canopy with a small-diameter, tube-type inflation but no bulbous crown. A 32-inch-long reefing line, giving a 10-inch-diameter reefing-line circle produced a 4% drag area and a slightly bulbous crown. Small ribbon parachutes cannot be reefed below 4% of the fully open drag area, probably because of the rough surface of the ribbon canopy. Large parachutes can be reefed to lower values than small parachutes because of relative size effect. Wind-tunnel models, smaller than about 3 feet nominal diameter, cannot be reefed much below 10% because of the relative stiffness of the model parachute. Tests for determining reefing characteristics, therefore, must be conducted on larger parachutes.
Skirt reefing has been used successfully on most circular parachute canopies, including disk-gap-band parachutes (Reference 5.111). Cross parachutes can be skirt reefed; however, inflation through the side pockets results in a bulbous crown and a minimum reefed drag area (reefing ratio) of about 10% of the fully open parachute (References 5.28 and 5.29). Guide surface parachutes are difficult to reef. Decreasing the skirt diameter with a reefing line flattens the canopy with little drag-area decrease followed by a sudden collapse of the canopy.
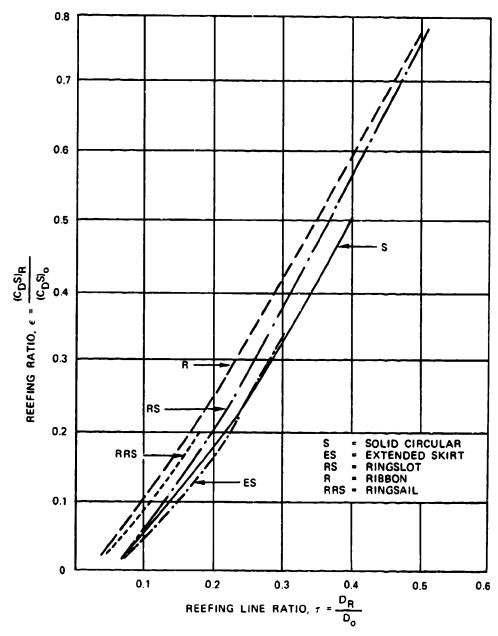
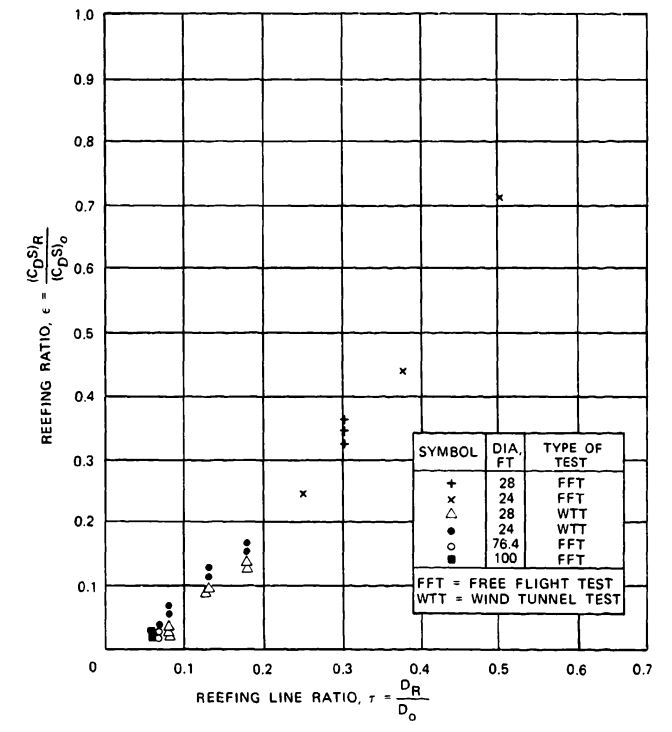
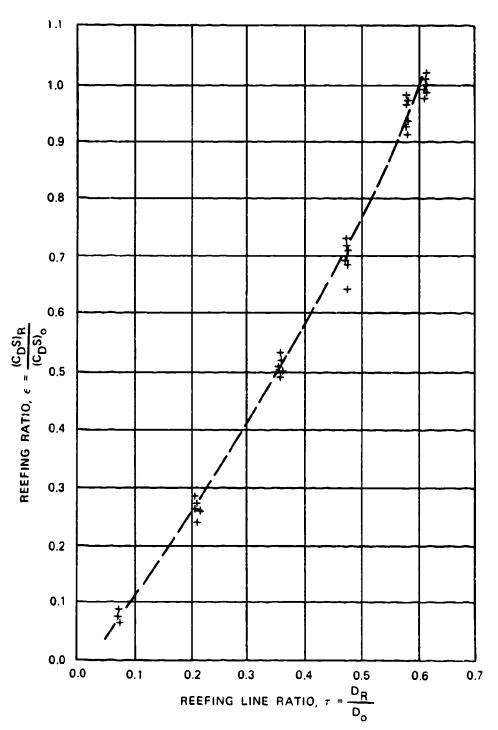
The required reefing-line length, Failed to parse (SVG (MathML can be enabled via browser plugin): Invalid response ("Math extension cannot connect to Restbase.") from server "https://wikimedia.org/api/rest_v1/":): {\displaystyle L_R} , for a specific reefed drag area, Failed to parse (SVG (MathML can be enabled via browser plugin): Invalid response ("Math extension cannot connect to Restbase.") from server "https://wikimedia.org/api/rest_v1/":): {\displaystyle (C_DS)_R} , is determined as follows:
The required reefing ratio (drag-area ratio), Failed to parse (SVG (MathML can be enabled via browser plugin): Invalid response ("Math extension cannot connect to Restbase.") from server "https://wikimedia.org/api/rest_v1/":): {\displaystyle \epsilon} , is obtained by dividing the reefed drag area by the drag area of the fully open parachute. Figures 5-71 through 5-73 show, for a given reefing ratio Failed to parse (SVG (MathML can be enabled via browser plugin): Invalid response ("Math extension cannot connect to Restbase.") from server "https://wikimedia.org/api/rest_v1/":): {\displaystyle \epsilon} ,
Failed to parse (SVG (MathML can be enabled via browser plugin): Invalid response ("Math extension cannot connect to Restbase.") from server "https://wikimedia.org/api/rest_v1/":): {\displaystyle \epsilon=\frac{(C_DS)_R}{(C_DS)_o}} the required reefing-line ratio Failed to parse (SVG (MathML can be enabled via browser plugin): Invalid response ("Math extension cannot connect to Restbase.") from server "https://wikimedia.org/api/rest_v1/":): {\displaystyle \tau=\frac{D_R}{D_o}}
where Failed to parse (SVG (MathML can be enabled via browser plugin): Invalid response ("Math extension cannot connect to Restbase.") from server "https://wikimedia.org/api/rest_v1/":): {\displaystyle D_o} is the known nominal diameter of the parachute and Failed to parse (SVG (MathML can be enabled via browser plugin): Invalid response ("Math extension cannot connect to Restbase.") from server "https://wikimedia.org/api/rest_v1/":): {\displaystyle D_R} is the diameter of the reefing-line circle. The length of the reefing line is now calculated Failed to parse (SVG (MathML can be enabled via browser plugin): Invalid response ("Math extension cannot connect to Restbase.") from server "https://wikimedia.org/api/rest_v1/":): {\displaystyle L_R=D_o \pi \tau} , the installed length of the line. Additions must be made for the overlap, or Chinese finger splice, as explained in section 6.5.
5.6.8 Forces in Reefing Lines
The forces in the reefing line and its components must be known before the reefing system is designed. Force and trajectory calculations as a function of time determine the reefing stages and the parachute loads in the individual stages. It is practical to define the reefing-line force, Failed to parse (SVG (MathML can be enabled via browser plugin): Invalid response ("Math extension cannot connect to Restbase.") from server "https://wikimedia.org/api/rest_v1/":): {\displaystyle F_R} , as a function of the known reefed parachute force, Failed to parse (SVG (MathML can be enabled via browser plugin): Invalid response ("Math extension cannot connect to Restbase.") from server "https://wikimedia.org/api/rest_v1/":): {\displaystyle F_{RL}} , for the particular reefing stage.
Figure 5-74 shows that the force in the reefing line, Failed to parse (SVG (MathML can be enabled via browser plugin): Invalid response ("Math extension cannot connect to Restbase.") from server "https://wikimedia.org/api/rest_v1/":): {\displaystyle F_{RL}} , is related to the radial force, R, at the skirt of the parachute canopy. The radial force, in turn, depends on the parachute force, FR, and the angle, 8, between the canopy radials and the suspension lines. The radial force and the force in the reefing line increase with an increase in the angle. A parachute with a bulbous inflation has a larger radial and reefing-line force, as does a parachute with longer suspension lines, because of the geometry of the system.
Figure 5-75, taken from Reference 5.112, shows the shape of a ribbon-parachute model during various stages of reefing as tested in a wind tunnel.
In a 1981 report, the author summarized all data available to that time on reefing-line forces (Reference 5.113). This report explains the difference between the reefing-line forces of a high-canopy-loading drogue-type parachute, where the maximum reefing-line force occurs at full reefed inflation, and a low-canopy-loading final-descent parachute. The maximum reefing-line force on the latter occurs before full reefed inflation because of the velocity decay during reefed opening (Figure 5-76). On unreefed, low-canopy-loading parachutes, the maximum force also occurs before full inflation. The high-canopy-loading parachute's reefing-line forces are 3 to 4% of the reefed opening forces, whereas large-diameter, low-canopy-loading parachutes (Items 22 and 23 in Figure 5-76) have reefing-line forces of approximately 1 to 2.5% of the maximum reefed force. The item definition in Figure 5-76 is the same as in Table 1 of Reference 5.113. Recent reefing-line force measurements by the Sandia National Laboratories agree with the data plotted in Figure 5-76.
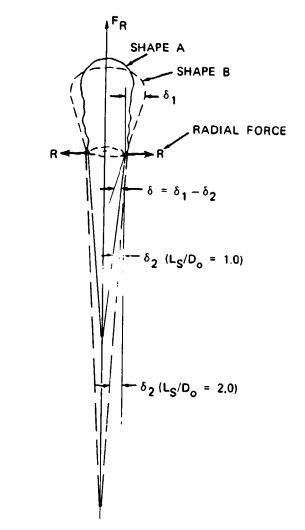
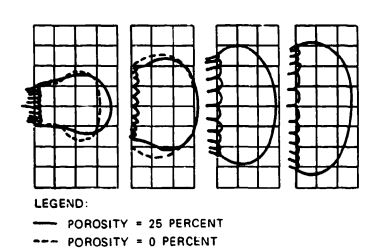
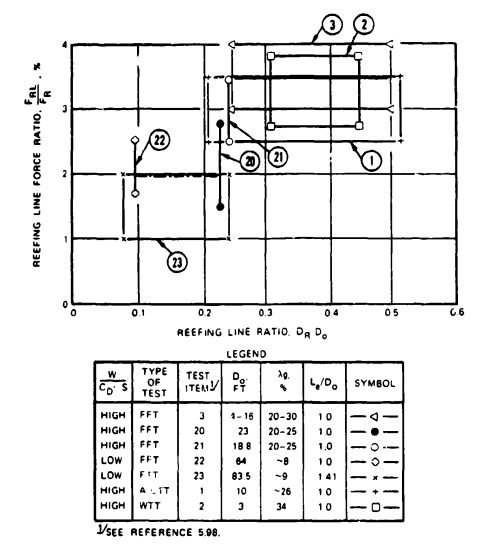
At Wright-Patterson Air Force Base, local accelerations on reefing cutters were measured in the 500 - to 1000-g range at the time of line stretch. During the Apollo program, Northrop Corporation in California duplicated these measurements with similar results. These data must be considered in the design of the reefing-cutter installation.
The following recommendations are made regarding forces in reefing lines:
1. Use a reefing-line-to-maximum-reefed-parachute-force ratio of 0.03 to 0.04 for the design of a first-stage drogue chute in the medium-to-high subsonic range. Consider the effect of suspension-line ratios, Failed to parse (SVG (MathML can be enabled via browser plugin): Invalid response ("Math extension cannot connect to Restbase.") from server "https://wikimedia.org/api/rest_v1/":): {\displaystyle L_e/D_o} , greater than 1.0; the effect of porosity; and the higher opening-shock factor, Failed to parse (SVG (MathML can be enabled via browser plugin): Invalid response ("Math extension cannot connect to Restbase.") from server "https://wikimedia.org/api/rest_v1/":): {\displaystyle C_x} , of supersonic parachutes in the dimensioning of the reefing line.
2. Use a reefing-line-to-maximum-reefed-parachute-force ratio of 0.03 for ordnance retardation parachutes and parachutes with canopy loadings, Failed to parse (SVG (MathML can be enabled via browser plugin): Invalid response ("Math extension cannot connect to Restbase.") from server "https://wikimedia.org/api/rest_v1/":): {\displaystyle (W/C_D)_p} , in the 3-to 40-Failed to parse (SVG (MathML can be enabled via browser plugin): Invalid response ("Math extension cannot connect to Restbase.") from server "https://wikimedia.org/api/rest_v1/":): {\displaystyle lb/ft^2} range.
3. Use a reefing-line-to-maximum-reefed-parachute-force ratio of 0.025 minimum for the design of large, final descent parachutes. This ratio should be increased for parachutes with unknown reefing characteristics, for small parachutes, and for parachutes with large reefing ratios.
4. A 2.5 safety factor is recommended for the design of all components of the reefing system.
5. Give special attention to ensure smooth reefing-cutter hole finishes, straight-through routing of reefing lines, proper reefing-ring attachment, and proper actuation of the reefing cutters.
5.6.9 Fixed Pocketband Reefing
Experience has shown that the required design porosity, Failed to parse (SVG (MathML can be enabled via browser plugin): Invalid response ("Math extension cannot connect to Restbase.") from server "https://wikimedia.org/api/rest_v1/":): {\displaystyle \lambda_T } , of slotted parachutes such as ribbon and ringslot is generally high enough to ensure positive inflation and good stability. However, under certain conditions, such as inflation in the wake of a large forebody, a higher porosity is necessary to ensure good stability. This porosity may be too high for proper inflation. The solution to this problem is fixed reefing.
Inflation is governed by the total canopy porosity, which ensures a positive pressure differential between the inside and outside of the canopy. The stability of the canopy is governed by the ratio of inflow into the canopy to outflow from the canopy. This ratio can be increased by reducing the canopy mouth area by a small amount of fixed reefing. This reefing does not change the canopy porosity and the positive pressure differential between the inside and outside of the canopy, but it increases the ratio of outflow to inflow into the canopy and improves the parachute stability. This method, which increases the effective porosity of the parachute, was used successfully on the supersonic drogue chute of the Mercury capsule. The 4-foot inflated diameter of the 6-foot-nominal-diameter drogue chute was smaller than the diameter of the Mercury capsule, which caused some instability and heavy canopy breathing. Using a 6.8-foot-diameter conical ribbon parachute reefed to the inflated diameter of a 6.0-foot-diameter parachute resulted in a stable parachute with reduced breathing. The effective porosity of the canopy, Failed to parse (SVG (MathML can be enabled via browser plugin): Invalid response ("Math extension cannot connect to Restbase.") from server "https://wikimedia.org/api/rest_v1/":): {\displaystyle \lambda_{eff}} ,was increased by the ratio
Failed to parse (SVG (MathML can be enabled via browser plugin): Invalid response ("Math extension cannot connect to Restbase.") from server "https://wikimedia.org/api/rest_v1/":): {\displaystyle \lambda_{eff}=\lambda_T\frac{S_2}{S_1}}
where Failed to parse (SVG (MathML can be enabled via browser plugin): Invalid response ("Math extension cannot connect to Restbase.") from server "https://wikimedia.org/api/rest_v1/":): {\displaystyle S_1} is the canopy area of the 6.0-foot-diameter parachute, and Failed to parse (SVG (MathML can be enabled via browser plugin): Invalid response ("Math extension cannot connect to Restbase.") from server "https://wikimedia.org/api/rest_v1/":): {\displaystyle S_2} is the canopy area of the 6.8-foot-diameter parachute.
This ratio can be written in the form
Failed to parse (SVG (MathML can be enabled via browser plugin): Invalid response ("Math extension cannot connect to Restbase.") from server "https://wikimedia.org/api/rest_v1/":): {\displaystyle \lambda_{eff}=\lambda_T\frac{D_o^2}{D_1^2}}
where Failed to parse (SVG (MathML can be enabled via browser plugin): Invalid response ("Math extension cannot connect to Restbase.") from server "https://wikimedia.org/api/rest_v1/":): {\displaystyle D_o} is the nominal diameter of the unreefed parachute, and Failed to parse (SVG (MathML can be enabled via browser plugin): Invalid response ("Math extension cannot connect to Restbase.") from server "https://wikimedia.org/api/rest_v1/":): {\displaystyle D_1} , is the equivalent nominal diameter of the reefed parachute.
The required diameter for the unreefed parachute is calculated
Failed to parse (SVG (MathML can be enabled via browser plugin): Invalid response ("Math extension cannot connect to Restbase.") from server "https://wikimedia.org/api/rest_v1/":): {\displaystyle D_o=D_1\frac{\lambda_{eff}}{\lambda_T}}
where
Failed to parse (SVG (MathML can be enabled via browser plugin): Invalid response ("Math extension cannot connect to Restbase.") from server "https://wikimedia.org/api/rest_v1/":): {\displaystyle D_o} - the nominal diameter of the parachute
Failed to parse (SVG (MathML can be enabled via browser plugin): Invalid response ("Math extension cannot connect to Restbase.") from server "https://wikimedia.org/api/rest_v1/":): {\displaystyle D_1} - the nominal equivalent diameter of a parachute with the required drag area
Failed to parse (SVG (MathML can be enabled via browser plugin): Invalid response ("Math extension cannot connect to Restbase.") from server "https://wikimedia.org/api/rest_v1/":): {\displaystyle \lambda_T } - the porosity required to ensure proper inflation
Failed to parse (SVG (MathML can be enabled via browser plugin): Invalid response ("Math extension cannot connect to Restbase.") from server "https://wikimedia.org/api/rest_v1/":): {\displaystyle \lambda_{eff}} - the porosity required for good stability
In the case of the Mercury drogue chute, a 26% total porosity, Failed to parse (SVG (MathML can be enabled via browser plugin): Invalid response ("Math extension cannot connect to Restbase.") from server "https://wikimedia.org/api/rest_v1/":): {\displaystyle \lambda_T }
, was selected for good inflation, resulting in an effective porosity
Failed to parse (SVG (MathML can be enabled via browser plugin): Invalid response ("Math extension cannot connect to Restbase.") from server "https://wikimedia.org/api/rest_v1/":): {\displaystyle \lambda_{eff}=26\frac{6.8^2}{6.0^2}=33.3%}
This type of fixed reefing is best achieved by pocketband reefing. Design details of the pocketband method are described in section 6.5.4.
Overinflation Control (OC) Line. The Apollo drogue chutes tested behind a small-diameter test vehicle were stable and exhibited no canopy breathing. However, the parachute exhibited heavy breathing in the wake of the large Apollo command module forebody (Figure 5-49). The breathing was considerably restrained by the installation of an OC line; the opening-force coefficient decreased from about 1.46 to 1.31 (Figure 5-49). This OC line is installed around the skirt of the parachute canopy in the same manner as a reefing line. The OC line permits full canopy inflation but not overinflation. To dimensionalize the OC line, the dimension of a fully inflated canopy must be analyzed (Figure 5-77). The skirt diameter, Failed to parse (SVG (MathML can be enabled via browser plugin): Invalid response ("Math extension cannot connect to Restbase.") from server "https://wikimedia.org/api/rest_v1/":): {\displaystyle D_s} , is slightly smaller than the projected or inflated canopy diameter, Failed to parse (SVG (MathML can be enabled via browser plugin): Invalid response ("Math extension cannot connect to Restbase.") from server "https://wikimedia.org/api/rest_v1/":): {\displaystyle D_p} . The projected diameter for a particular parachute type is independent of the number of canopy gores. The skirt diameter increases with the number of gores. The projected diameter varies with parachute type, canopy porosity, and suspension-line length. Average projected diameters for parachutes with normal porosity and line-length ratios of 1.0 are as follows:
Failed to parse (SVG (MathML can be enabled via browser plugin): Invalid response ("Math extension cannot connect to Restbase.") from server "https://wikimedia.org/api/rest_v1/":): {\displaystyle D_p/D_o} =0.67 for ribbon parachutes
Failed to parse (SVG (MathML can be enabled via browser plugin): Invalid response ("Math extension cannot connect to Restbase.") from server "https://wikimedia.org/api/rest_v1/":): {\displaystyle D_p/D_o} = 0.68 for flat, circular, fabric parachutes
Failed to parse (SVG (MathML can be enabled via browser plugin): Invalid response ("Math extension cannot connect to Restbase.") from server "https://wikimedia.org/api/rest_v1/":): {\displaystyle D_p/D_o} = 0.70 for extended-skirt parachutes
Failed to parse (SVG (MathML can be enabled via browser plugin): Invalid response ("Math extension cannot connect to Restbase.") from server "https://wikimedia.org/api/rest_v1/":): {\displaystyle D_p/D_o} = 0.72 for triconical parachutes
Figure 5-78 shows the effect of the number of gores on the skirt diameter for a ribbon parachute with a projected diameter of 0.67 Failed to parse (SVG (MathML can be enabled via browser plugin): Invalid response ("Math extension cannot connect to Restbase.") from server "https://wikimedia.org/api/rest_v1/":): {\displaystyle D_o} . No equivalent data are available for other parachute types; it is therefore recommended that appropriate percentage values be used. OC-line installation is discussed further in section 6.5.4
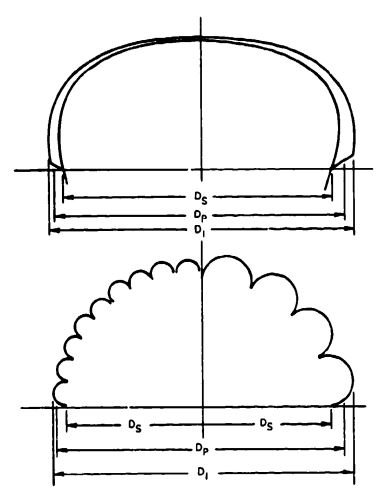
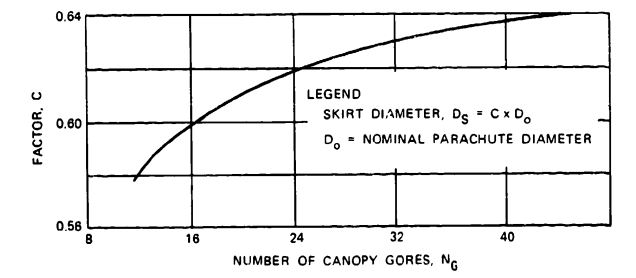
5.6.10 Reefing of Small-Diameter Parachutes
Small-diameter parachutes generally have few gores and a resultant low ratio of skirt diameter, Failed to parse (SVG (MathML can be enabled via browser plugin): Invalid response ("Math extension cannot connect to Restbase.") from server "https://wikimedia.org/api/rest_v1/":): {\displaystyle D_s} , to nominal diameter, Failed to parse (SVG (MathML can be enabled via browser plugin): Invalid response ("Math extension cannot connect to Restbase.") from server "https://wikimedia.org/api/rest_v1/":): {\displaystyle D_o} (Figure 5-77). The ratio of skirt diameter to nominal diameter versus number of gores for ribbon parachutes is shown in Figure 5-78 and defined as Failed to parse (SVG (MathML can be enabled via browser plugin): Invalid response ("Math extension cannot connect to Restbase.") from server "https://wikimedia.org/api/rest_v1/":): {\displaystyle C=D_s/D_o} . A similar relationship is valid for other types of parachutes. All data on reefing-ratio-versus-reefing-line-diameter ratios in Figures 5-71 through 5-73 are based on parachutes with 24 or more gores. For parachutes with fewer gores, these data result in reefing lines too long for the required drag area. The following approach is recommended for determining the reefing-line circle diameter, Failed to parse (SVG (MathML can be enabled via browser plugin): Invalid response ("Math extension cannot connect to Restbase.") from server "https://wikimedia.org/api/rest_v1/":): {\displaystyle D_R} . for parachutes with a small number of gores.
Failed to parse (SVG (MathML can be enabled via browser plugin): Invalid response ("Math extension cannot connect to Restbase.") from server "https://wikimedia.org/api/rest_v1/":): {\displaystyle D_R=D_o\ \tau\ C }
where
Failed to parse (SVG (MathML can be enabled via browser plugin): Invalid response ("Math extension cannot connect to Restbase.") from server "https://wikimedia.org/api/rest_v1/":): {\displaystyle D_R} = reefing-line circle diameter
Failed to parse (SVG (MathML can be enabled via browser plugin): Invalid response ("Math extension cannot connect to Restbase.") from server "https://wikimedia.org/api/rest_v1/":): {\displaystyle D_o} = nominal parachute diameter
Failed to parse (SVG (MathML can be enabled via browser plugin): Invalid response ("Math extension cannot connect to Restbase.") from server "https://wikimedia.org/api/rest_v1/":): {\displaystyle \tau} = reefing-line-circle-diameter-to-reefing ratio, from Figures 5-71 through 5-73
Failed to parse (SVG (MathML can be enabled via browser plugin): Invalid response ("Math extension cannot connect to Restbase.") from server "https://wikimedia.org/api/rest_v1/":): {\displaystyle C} =Failed to parse (SVG (MathML can be enabled via browser plugin): Invalid response ("Math extension cannot connect to Restbase.") from server "https://wikimedia.org/api/rest_v1/":): {\displaystyle D_s/D_o} ratio, from Figure 5-78, for parachutes with few gores
For parachutes with long reefing lines, the elongation caused by the force in the reefing line should be included in determining the required reefing-line length.
5.7 CANOPY SHAPE AND CANOPY PRESSURE DISTRIBUTION
Knowledge of the parachute canopy shape and canopy pressure distribution are important for the design and stress analysis of parachutes, especially if the CANO or CALA computer programs are used for determining canopy stress. Both programs are discussed in section 6.4.
5.7.1 Parachute Canopy Shape
The inflated shape of a parachute canopy depends on the type and geometric design of the canopy (flat, conical, triconical, hemispherical, or other shaped-gore design), on the canopy porosity, and on the suspension-line length. Because the canopy shape depends on these factors, non-variable, nominal parachute diameter, Failed to parse (SVG (MathML can be enabled via browser plugin): Invalid response ("Math extension cannot connect to Restbase.") from server "https://wikimedia.org/api/rest_v1/":): {\displaystyle D_o} . and the related surface area, Failed to parse (SVG (MathML can be enabled via browser plugin): Invalid response ("Math extension cannot connect to Restbase.") from server "https://wikimedia.org/api/rest_v1/":): {\displaystyle S_o} , are selected as references for such aerodynamic coefficients as Failed to parse (SVG (MathML can be enabled via browser plugin): Invalid response ("Math extension cannot connect to Restbase.") from server "https://wikimedia.org/api/rest_v1/":): {\displaystyle C_{D_o}} , Failed to parse (SVG (MathML can be enabled via browser plugin): Invalid response ("Math extension cannot connect to Restbase.") from server "https://wikimedia.org/api/rest_v1/":): {\displaystyle C_L} , Failed to parse (SVG (MathML can be enabled via browser plugin): Invalid response ("Math extension cannot connect to Restbase.") from server "https://wikimedia.org/api/rest_v1/":): {\displaystyle C_m} and others.
Figure 5.79 shows the canopy cross sections along the radials for two ribbon parachutes with 9.9 - and 9.6-foot diameters. These parachutes were tested in the Massie Memorial Wind Tunnel at Wright-Patterson Air Force Base, and in a large wind tunnel at Chalois Moudin, France. The shapes of the canopies are formed by the balance of internal pressure forces and the tension in the suspension lines. A higher internal pressure and longer suspension lines will result in larger inflated canopies.
The Sandia National Laboratories have measured the effect of canopy porosity and line length on canopy shape (Reference 5.114). These tests indicate that a decrease in canopy porosity and an increase in suspension-line length are the prime reasons for an increase in inflated canopy diameter and associated increase in drag coefficient. The increase in inflated canopy diameter with decreasing canopy porosity is shown in Figure 5-80, and the effect of suspension-line length in Figure 5-81. The increase in canopy diameter from a line-ratio increase of Failed to parse (SVG (MathML can be enabled via browser plugin): Invalid response ("Math extension cannot connect to Restbase.") from server "https://wikimedia.org/api/rest_v1/":): {\displaystyle L_e/D_o =1.0} to Failed to parse (SVG (MathML can be enabled via browser plugin): Invalid response ("Math extension cannot connect to Restbase.") from server "https://wikimedia.org/api/rest_v1/":): {\displaystyle L_e/D_o=1.5} is larger than the increase from a 1.5 to 2.0 ratio. This increase agrees with data plotted in Figure 5-20, where the increase in the drag coefficient is 7% for a line-ratio increase from 1.0 to 1.5 but only about 3% for a line-length increase from 1.5 to 2.0.
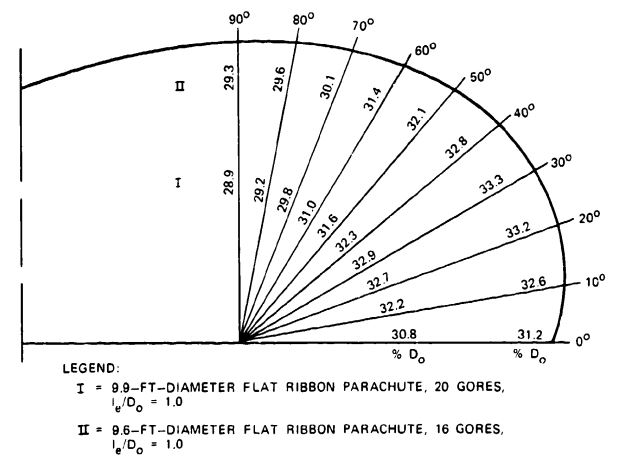
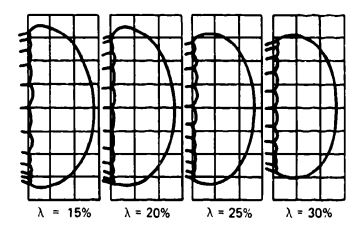
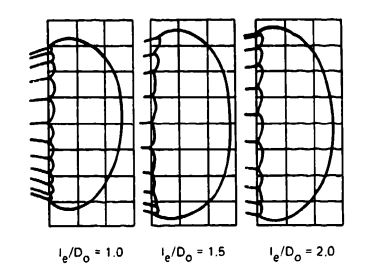
5.7.2 Pressure Distribution in Parachute Canopies
Knowing the pressure distribution over the parachute canopy is important for analyzing the inflation characteristics of the canopy and for determining canopy stresses. Figure 4-10 shows the airflow and pressure distribution on several aerodynamic bodies. The general rule in aerodynamics is to prevent airflow separation and keep the airflow "attached" to the air vehicle to minimize air-vehicle drag. The opposite condition is desirable for parachutes in which uniform airflow separation around the leading edge of the canopy and uniform wake behind the canopy are required for obtaining high drag and good stability.
Figure 5-82 shows the airflow around a parachute canopy. The airflow in front of the canopy is decelerated to zero at the stagnation point, I. Behind the stagnation point, turbulent airflow occurs, resulting in a high static pressure inside the parachute canopy compared to the static pressure in the undisturbed flow of the free airstream around the canopy. The airflow around the edge of the canopy is accelerated by the compression of the streamlines, as described in Chapter 4, causing a negative pressure on the outside of the canopy. The positive inside pressure and the negative outside pressure form a strong outwardly directed pressure gradient that keeps the canopy inflated.
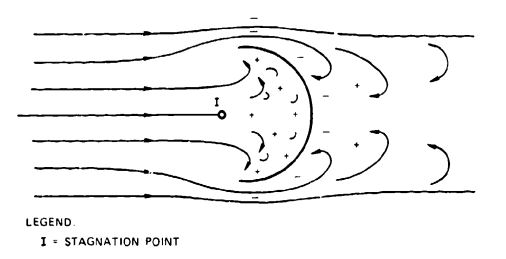
Bernoulli's Law states that Failed to parse (SVG (MathML can be enabled via browser plugin): Invalid response ("Math extension cannot connect to Restbase.") from server "https://wikimedia.org/api/rest_v1/":): {\displaystyle p+q=p_o} , where p is the static pressure, q the dynamic pressure, and Failed to parse (SVG (MathML can be enabled via browser plugin): Invalid response ("Math extension cannot connect to Restbase.") from server "https://wikimedia.org/api/rest_v1/":): {\displaystyle p_o} the total pressure. From this equation we can derive the dimensionless pressure coefficient, Failed to parse (SVG (MathML can be enabled via browser plugin): Invalid response ("Math extension cannot connect to Restbase.") from server "https://wikimedia.org/api/rest_v1/":): {\displaystyle c_p} , with
Failed to parse (SVG (MathML can be enabled via browser plugin): Invalid response ("Math extension cannot connect to Restbase.") from server "https://wikimedia.org/api/rest_v1/":): {\displaystyle c_p=\frac{p_o-p}{q} } or Failed to parse (SVG (MathML can be enabled via browser plugin): Invalid response ("Math extension cannot connect to Restbase.") from server "https://wikimedia.org/api/rest_v1/":): {\displaystyle C_p=\frac{\Delta p}{q}}
Figure 5-83, from Reference 2.2, shows the external pressure coefficient, Failed to parse (SVG (MathML can be enabled via browser plugin): Invalid response ("Math extension cannot connect to Restbase.") from server "https://wikimedia.org/api/rest_v1/":): {\displaystyle c_p} , versus Mach number for a metal hemisphere with a geometric porosity of 20%, which simulates a ribbon-type parachute
Figure 5-84, also from Reference 2.2, shows graphically the inside and the outside pressure coefficients versus Mach numbers, and shows numerically the total pressure differential coefficients for Mach 0.61 for a ribbon-type metal canopy. The strong pressure differential at the skirt of the canopy and the lower pressure differential at the vent are clearly indicated, as is the decrease in pressure gradient with a decrease in Mach number.
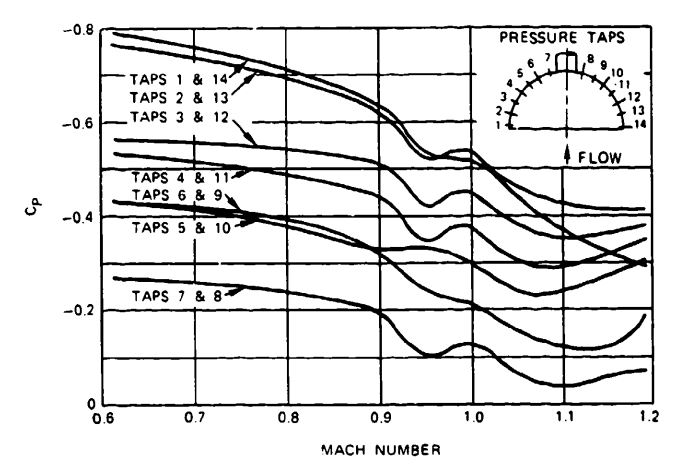
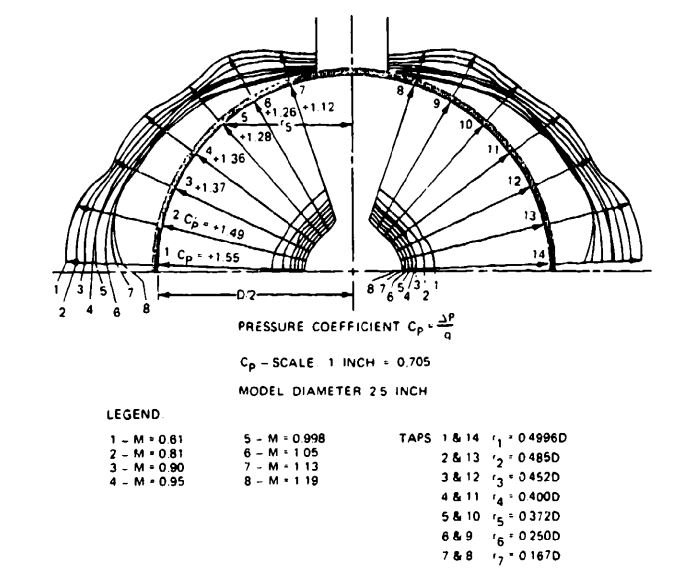
Measuring pressure distribution in fully open flexible canopies and during inflation is quite difficult, especially for finite-mass conditions, which must be measured in free-flight tests. In the 1960s the University of Minnesota developed special pressure gages to be used with flexible textile parachutes. This work was continued and extended by the German Research Institute for Aeronautics and Astronautics (DVFLR) in Braunschweig, Germany, and by the Sandia National Laboratories. References 5.115 through 5.120 document these efforts. Figure 5-85 is from Reference 5.118, where Northrop, as a part of the Apollo program, replotted available pressure data for use in the development of the CANO program.
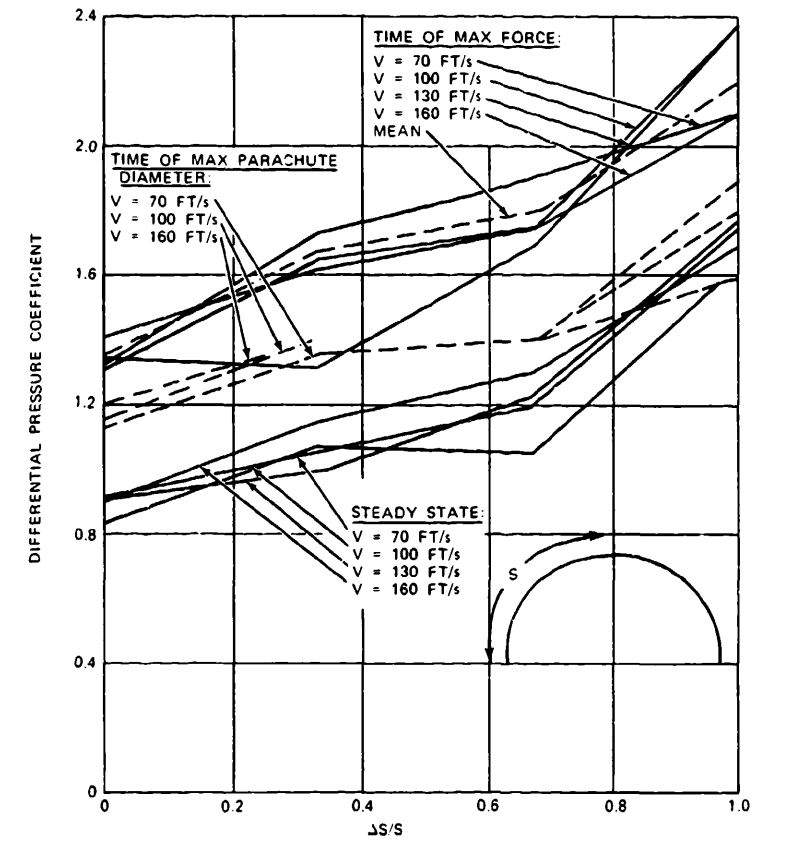
5.8 SUPERSONIC INFLATABLE DECELERATORS
5.8.1 Characteristics of Supersonic Flow
Parachutes and balloon-type decelerators have been used successfully at speeds in excess of Mach 4, at altitudes up to the limit of the atmosphere, at dynamic pressures of 12,000 Failed to parse (SVG (MathML can be enabled via browser plugin): Invalid response ("Math extension cannot connect to Restbase.") from server "https://wikimedia.org/api/rest_v1/":): {\displaystyle lb/ft^2} , and on Earth as well as on other planets. Selecting the proper decelerator and analyzing its operational environment, supersonic inflation, aerodynamic heating, and flutter and stress problems are important because these decelerators are more complex than subsonic inflatable decelerators.
Section 4.1.8 defines supersonic speed by the associated Mach number, where Mach number is the ratio of the ambient velocity to the velocity of sound, Failed to parse (SVG (MathML can be enabled via browser plugin): Invalid response ("Math extension cannot connect to Restbase.") from server "https://wikimedia.org/api/rest_v1/":): {\displaystyle c_s} . The velocity of sound is 1116.46 ft/s at sea level and standard day condition. The air is considered incompressible by a body moving at a speed below Mach 1. When a body moving through air approaches the speed of sound, the air becomes compressible and starts to form compression waves in front of the body; this process is associated with local changes in velocity, pressure, and temperature. For detailed information on supersonic aerodynamics, see References 4.3 to 4.5 and the extensive literature.
Figure 5-86 shows the supersonic flow around a bullet moving at supersonic speed. A shock wave forms at the bow of the bullet, and expansion waves form at the protruding corners and the tail of the bullet. Reverse airflow and a long drawn-out, necked-in wake follow immediately behind the bullet. Most air vehicles flying at supersonic speeds are highly streamlined to minimize the drag increase that occurs when approaching Mach 1. Figure 5-87 shows this drag increase as a function of Mach number for an ejectable aircraft nose section. This drag increase is generally associated with a decrease in lift and stability.
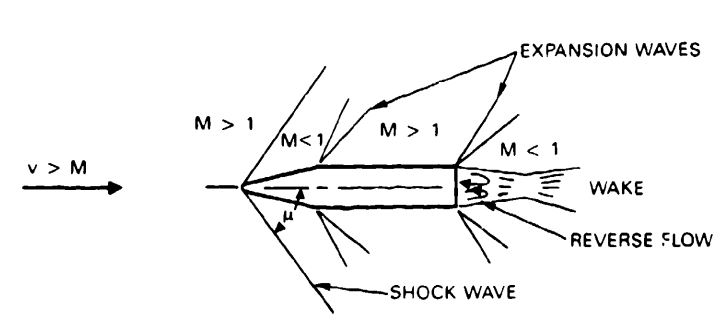
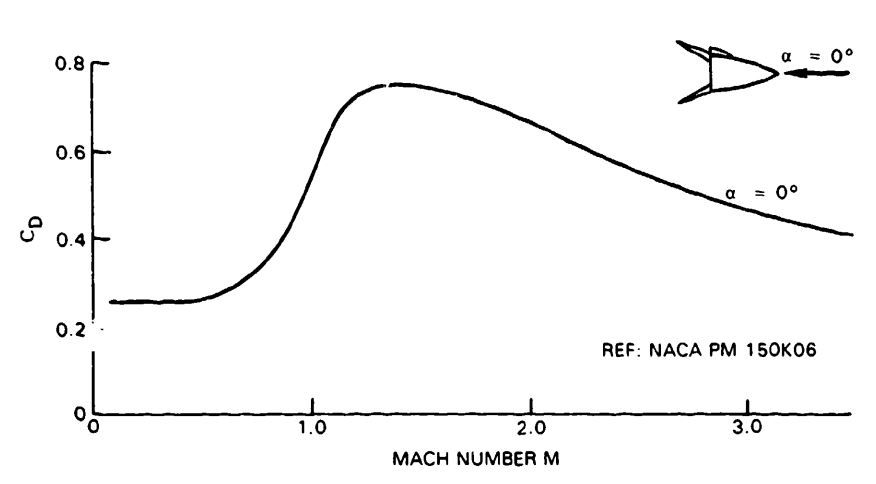
5.8.2 Supersonic Parachutes
The supersonic flow around a parachute canopy is distinctly different from the supersonic flow around a streamlined body, as shown in simplified form in Figure 5-88. A shock wave forms in front of the parachute canopy. As the supersonic velocity in front of the shock wave decreases to high subsonic velocity behind the shock wave, pressure, mass density, and temperature increase. Behind the canopy. a large wake forms with recirculation and negative pressure.
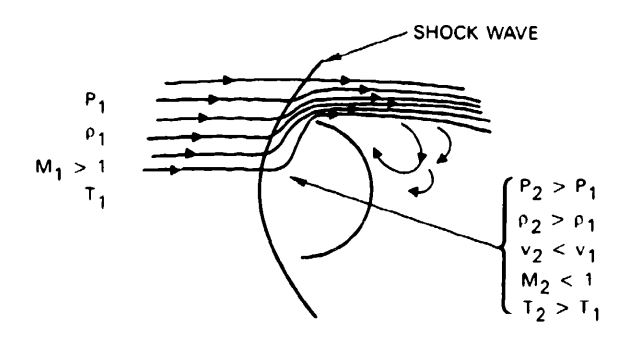
A parachute canopy is never used by itself. In front of the canopy are suspension lines, a suspension line confluence point, and, generally, a riser and a forebody. Figure 5.89 shows the supersonic flow field around a streamlined forebody with an attached aerodynamic decelerator at a velocity of approximately Mach 3. The distance between the forebody and the leading edge of the parachute is equal to six times the maximum forebody diameter, and the suspension line length is equal to two times the nominal parachute diameter, Failed to parse (SVG (MathML can be enabled via browser plugin): Invalid response ("Math extension cannot connect to Restbase.") from server "https://wikimedia.org/api/rest_v1/":): {\displaystyle D_o}
.
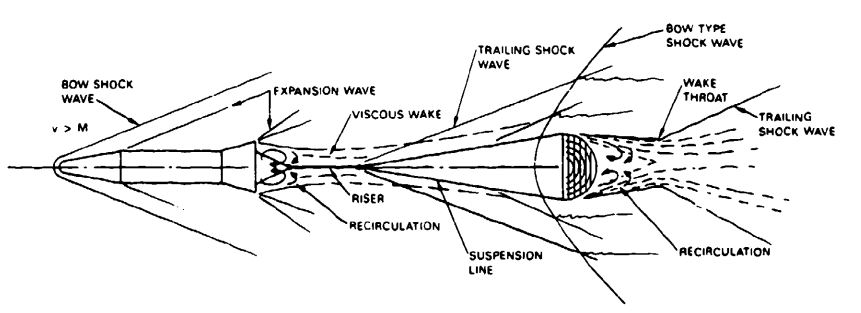
The flow field around the parachute canopy is seriously affected by the flow and the wake formed by the forebody, the riser, and the suspension lines. The relationship of forebody diameter to canopy diameter, the forebody shape, and the distance between forebody and leading edge of the parachute canopy cause considerable drag loss in the wake of the forebody.
In the early 1950s at Wright-Patterson Air Force Base, the Air Force started a research program to develop supersonic inflatable aerodynamic decelerators, including parachutes and, later, inflatable balloon-type devices. These investigations covered theoretical studies, wind-tunnel tests, sled tests, and free-flight tests that used rocket-boosted test vehicles.
Circular solid material types of parachutes were eliminated early in the program because of instability, canopy breathing, flutter, and stress problems. Flat ribbon parachutes in supersonic flow exhibited heavy breathing of the canopy leading edges, high-frequency flutter of canopy elements, and a tendency to close the mouth of the canopy at supersonic speeds.
Conical ribbon parachutes were suitable up to the Mach 2 to 2.5 range. Several new canopy designs were developed, including hemisflo ribbon, equiflo ribbon, and hyperflo parachutes. The hemisflo ribbon parachute proved to be the most practical design for velocities up to Mach 3.
In a follow-on program in the early 1960s, the Goodyear Aerospace Corporation developed the ballute (BALLoon-ParachUTE), an inflatable balloon-type decelerator discussed in detail in section 5.8.3.
At supersonic speeds, all parachutes exhibited canopy breathing, high-frequency ribbon flutter, and a progressive decrease in the canopy mouth area. The tested parachutes did not increase the drag coefficient while approaching Mach 1 but had a constant drag coefficient to about Mach 1.2 to 1.4. Thereafter, the drag coefficient decreased, because the gradual decrease in inflated parachute diameter acted as an automatic reefing system.
Parachute canopies of a spherical tension-shell shape, such as hemisflo and hyperflo designs, exhibited less breathing and flutter and a slower decrease in inflated diameter with increasing Mach number than did flat and conical parachutes.
Canopies with suspension lines twice as long as the nominal parachute diameter had higher drag and less tendency to gradual canopy closing.
A high canopy porosity is required to obtain sufficient airflow through the canopy to prevent canopy chocking. The three parachute types best suited for supersonic operations - the conical, hemisflo, and hyperflo ribbon parachutes- are shown in Figure 5-90.
Ribbed and ribless guide surface parachutes operated well at speeds up to Mach 1.4 but had high opening shocks and suffered structural damage caused by excessive flutter. Seam separation and material disintegration resulted.
Figure 5-91, taken from Reference 2.2. plots the drag coefficient, Failed to parse (SVG (MathML can be enabled via browser plugin): Invalid response ("Math extension cannot connect to Restbase.") from server "https://wikimedia.org/api/rest_v1/":): {\displaystyle C_{D_o}} , versus Mach number for four types of ribbon parachutes investigated in the Air Force program (References 5.121 to 5.124).
Since the Air Force research program, numerous supersonic wind-tunnel and free-flight tests have been conducted on parachutes. In wind-tunnel tests, canopy stress is very severe because of long exposure to high velocities. Heavy canopy breathing and high-speed flutter frequently result in material disintegration, seam separation. and canopy damage. In actual use, parachutes operate for only a short period of time in supersonic flow because of the normally high rate of deceleration typical of parachute systems. References 5.125 to 5.127 are three of the many reports available on the wind-tunnel and free-flight testing of parachutes deployed at supersonic velocities.
Low-altitude, high-dynamic-pressure application of nylon parachutes is limited to about Mach 2.2, because at higher speeds aerodynamic heating starts to melt the leading edge of the canopy and lightweight canopy parts, such as ribbons and tapes. Complete canopy destruction has been experienced on high canopy-loading ribbon parachutes deployed at Mach 3 at altitude and medium dynamic pressures.
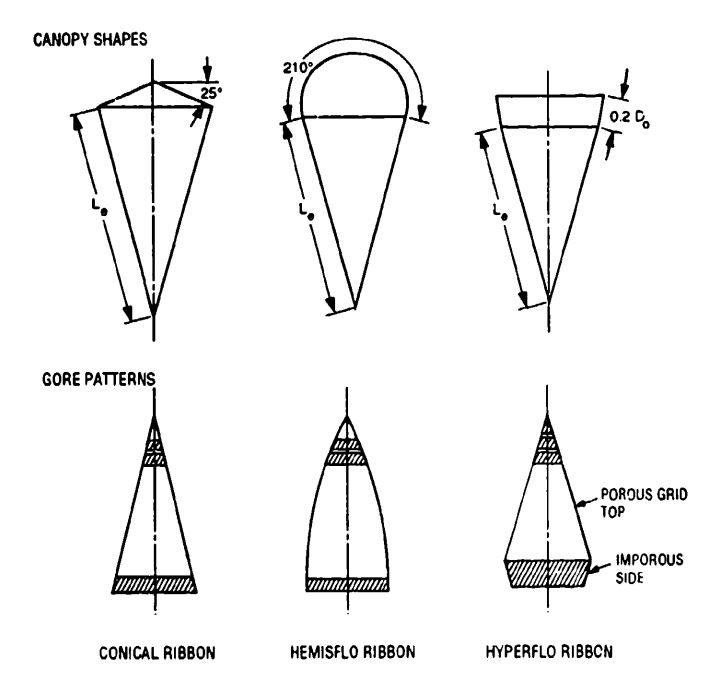
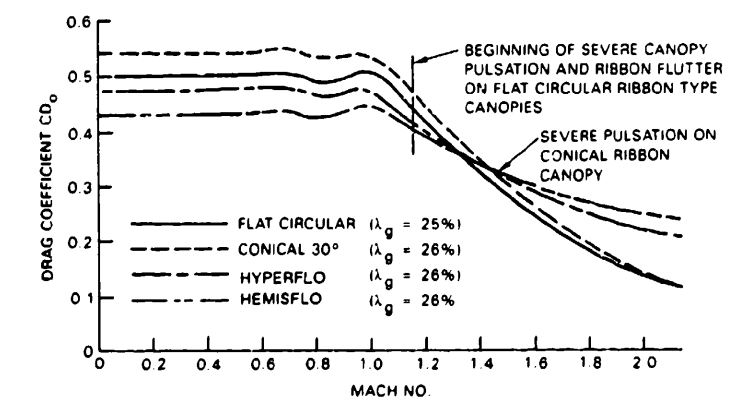
Slotted and solid material parachutes deployed at altitudes above 110,000 feet and at low dynamic pressures in NASAs PPEP program did not experience aerodynamic heating problems (Reference 5.101). References 5.128 and 5.129 discuss aerodynamic heating on parachutes and propose methods for calculating these transient temperatures. The forebody wake effect on supersonic decelerators is discussed in References 5.7 to 5.9, 5.130 and 5.131.
The Northrop Corporation summarized all available information on supersonic ribbon parachutes in the 1970s. The data in Figures 5-92 through 5-95 are from the Northrop report. References 5.132 through 5.134 confirm and supplement the Northrop data. The drag-area-versus-Mach-number graphs in Figure 5-96 have been successfully used in the computer analysis of time-velocity-force-position calculations of parachute recovery systems.
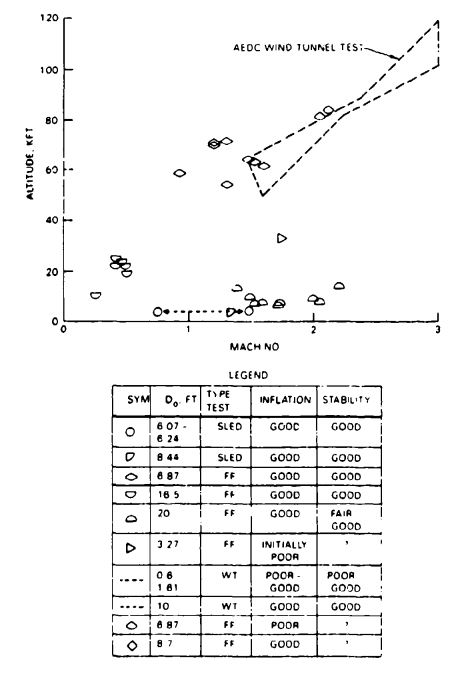
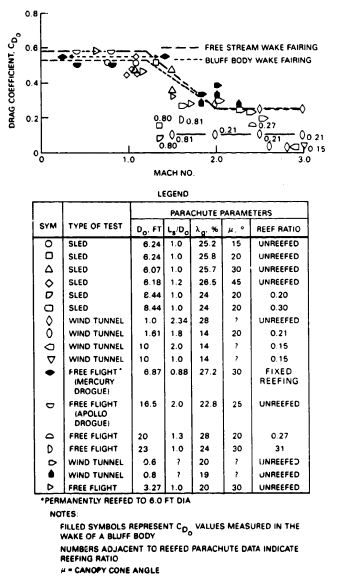
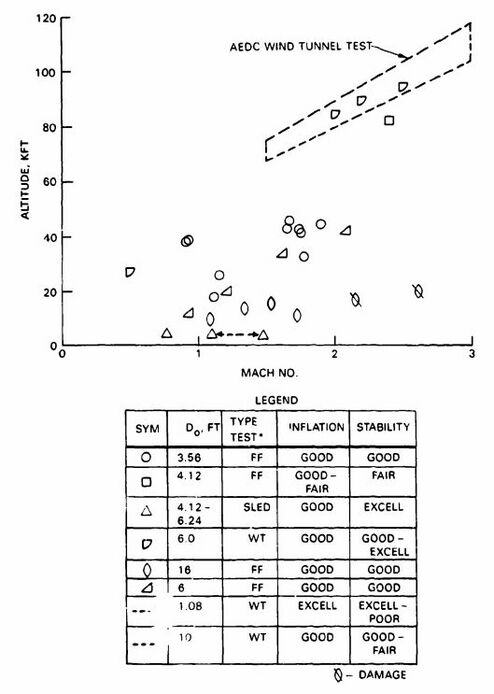
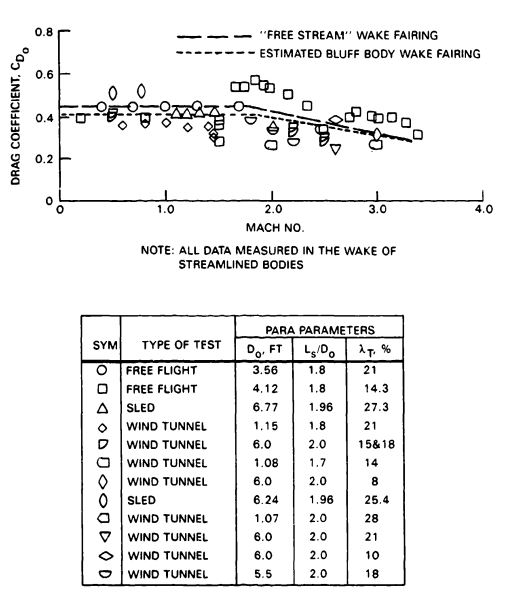
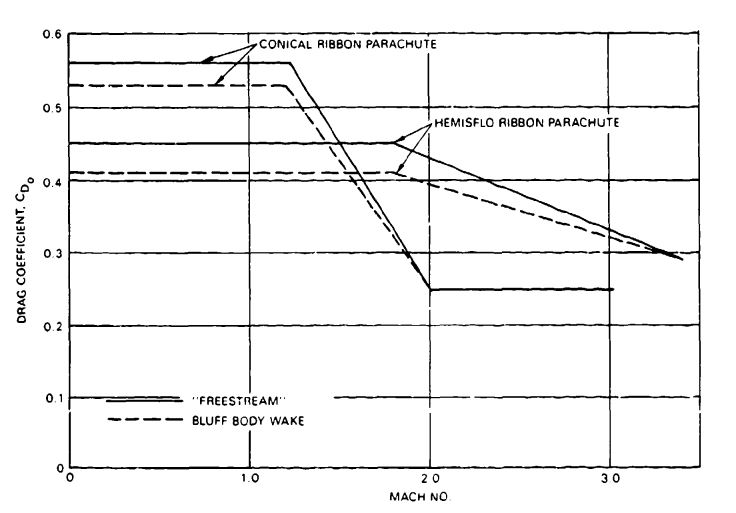
5.8.3 Balloon-Type Inflatable Decelerators
Several configurations of inflatable balloon-type decelerators have been investigated. So far only the ballute, developed by the Goodyear Aerospace Corporation under government contract (Reference 5.135), has been used operationally at subsonic and supersonic velocities. The configuration of the ballute, also called attached inflatable decelerator (AID), is illustrated in Figure 5-97. The balloon-shaped rear and center part is a tension shell; the conical forward part carries the loads to a junction point for connection with the forebody. A burble fence around the equator of the ballute creates a uniform flow separation, thereby eliminating destabilizing forces. The burble fence and the inverted conical front part together provide good stability. Air scoops in front of the burble fence ram-air inflate the ballute. Inflation with stored gas or gas generators has been investigated but was replaced with the simpler ram-air inflation method.
Figure 5-98 shows the ballute drag coefficient, Ctp, as a function of a Mach number. The drag coefficient relates to the inflated area of the ballute, Failed to parse (SVG (MathML can be enabled via browser plugin): Invalid response ("Math extension cannot connect to Restbase.") from server "https://wikimedia.org/api/rest_v1/":): {\displaystyle S_p} , and not to the total surface area, Failed to parse (SVG (MathML can be enabled via browser plugin): Invalid response ("Math extension cannot connect to Restbase.") from server "https://wikimedia.org/api/rest_v1/":): {\displaystyle S_o} , as is customary on parachutes.
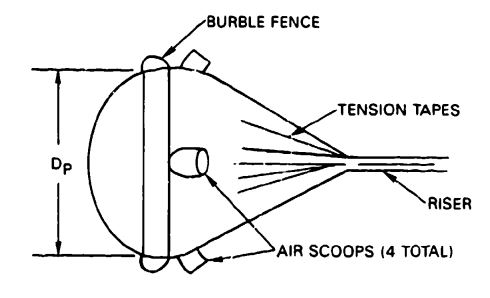
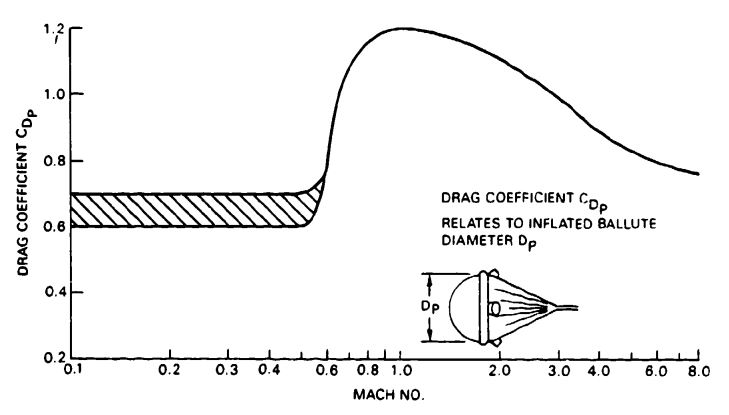
The inflation of the ballute is fast and uniform. Figure 5-99 compares force-time traces of a ballute and a parasonic parachute tested in the Tullohoma 16-foot supersonic wind tunnel at a constant velocity. The more uniform force, and the lower opening-force coefficient, Failed to parse (SVG (MathML can be enabled via browser plugin): Invalid response ("Math extension cannot connect to Restbase.") from server "https://wikimedia.org/api/rest_v1/":): {\displaystyle C_x}
, of the ballute are shown. The parasonic parachute is related to the hemisflo parachute (Reference 5.136).
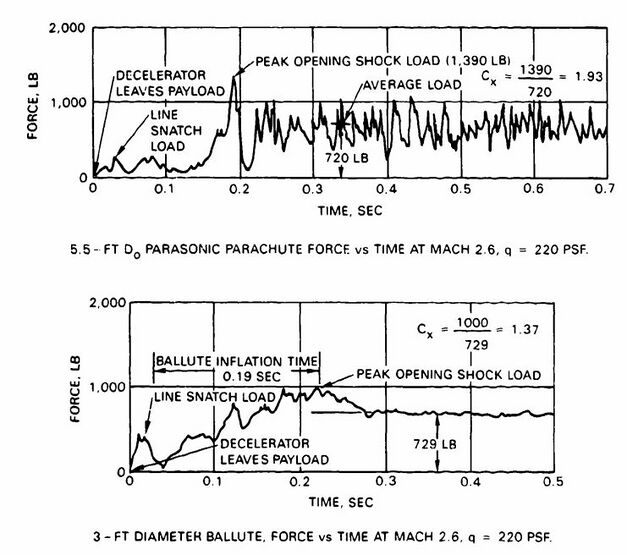
Known applications of the ballute are the stabilization/retardation device for the Gemini spacecraft back-up ejection seat with an upper deployment limit of Mach 4 at 80.000 feet altitude, and the low-altitude retarder for the Mk 82 bomb.
Figure 5-100 compares the drag coefficient, Failed to parse (SVG (MathML can be enabled via browser plugin): Invalid response ("Math extension cannot connect to Restbase.") from server "https://wikimedia.org/api/rest_v1/":): {\displaystyle C_{D_o}} , of the conical ribbon, hemisflo ribbon, and guide surface parachutes with the ballute. The solid lines refer to the recommended application range, and the dotted lines indicate areas with limited data or areas where the decelerator should be used with caution, The drag coefficient of the ballute is referenced to the total surface area and not to the projected area as in Figure 5-98. References 5.137 to 5.139 are part of the literature available on ballute testing and application.
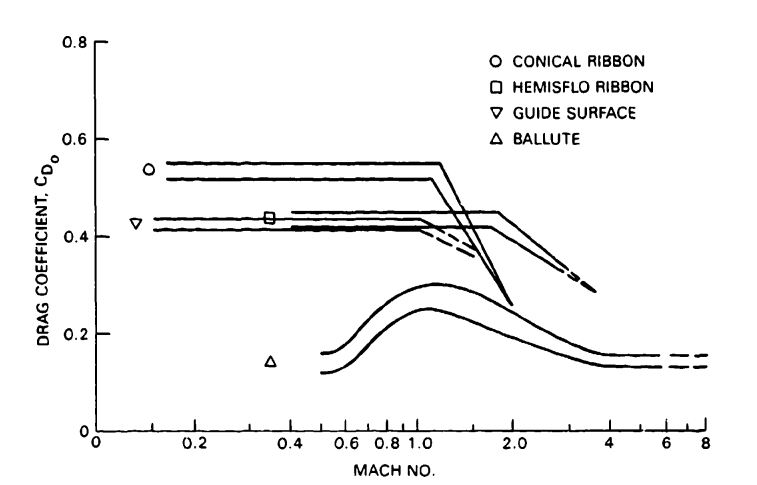
5.8.4 Miscellaneous Decelerators
Various aerodynamic decelerators of rigid, semirigid, rotating, and inflatable design have been suggested or tested in the past. Figure 5-101 shows some of these decelerators, and Reference 5.140 compares some of the proposed supersonic decelerators.
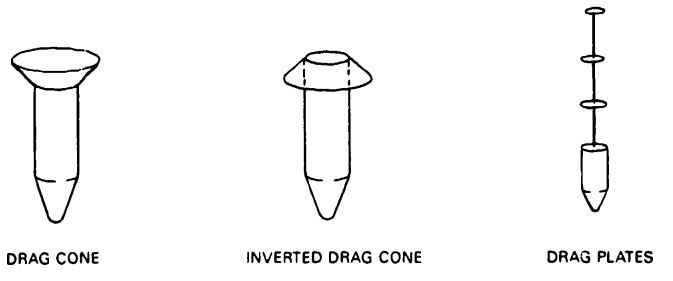
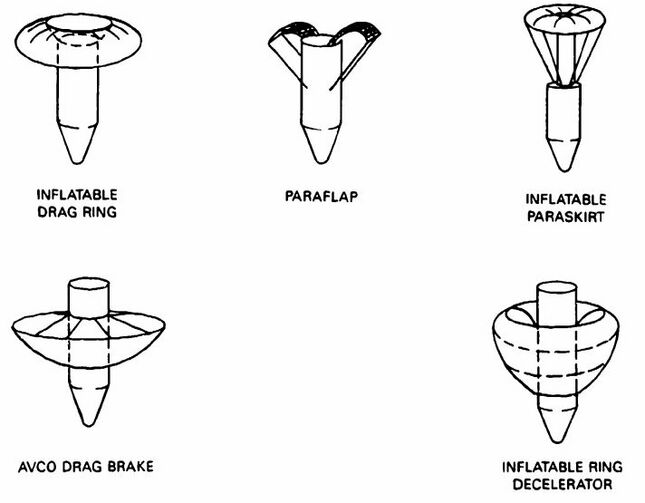
5.9 MANEUVERABLE (GLIDING) PARACHUTES
5.9.1 Parachute Types
Maneuverable parachutes in this manual refer to parachutes that can glide and turn and thereby provide the capability to fly toward a ground target or a selected landing area. Sport parachutists use these parachutes to perform aerial maneuvers. The desire to make parachutes maneuverable is as old as the use of parachutes. The first recorded attempt is that of the Frenchman, Lateur, who was killed in 1856 while testing a maneuverable parachute of his own design. The American, DeGraff, suffered a similar fate in 1887.
In 1929, E. I. Hoffman, formerly Chief of the U.S. Army Parachute Test Group at McCook Field, Ohio, developed the Hoffman triangle parachute, the first practical maneuverable parachute. It had a triangular canopy with two rounded corners and one cut-off corner, the latter forming an open scoop. Air exhausting horizontally from the scoop produced a thrust in one direction and a glide in the opposite direction. Pulling steering lines attached to both sides of the scoop deformed the canopy, causing air to be exhausted tangentially and the parachute to turn. The parachute's glide ratio was about 0.4 to 0.5 (Reference 5.141).
During World War II, the British developed the blank-gore parachute, a circular canopy with cloth removed from selected canopy gores to create thrust in one direction and glide in the opposite direction, as with the Hoffman triangle parachute. Turn control is again obtained by control lines and appropriate canopy deformation.
The best-known blank-gore-type parachute is the MC1-1B, a T-10 paratrooper parachute modified with double TU slots extending over 11 gores (see Figure 5.102). This parachute has a glide ratio L/D of 0.75 and a turn rate of 180 degrees in 5 seconds (Reference
5.142).
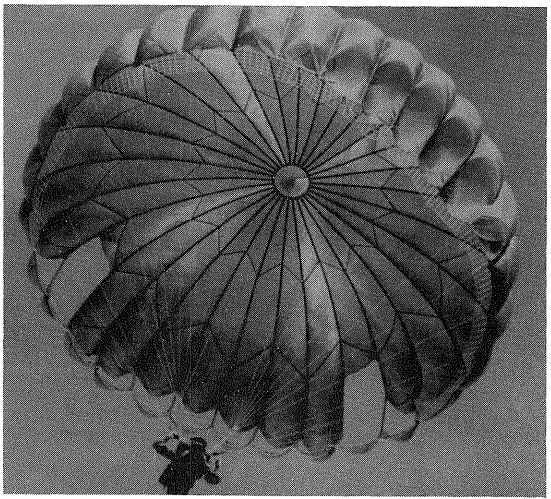
A notable increase in maneuvering performance was obtained by the French LeMoigne parachute, which combines multiple aerodynamically shaped canopy slots with stabilizer vanes and control lines. This parachute has obtained a glide ratio of 0.85 and a turn rate of better than 3 seconds for a 180-degree turn. The Pioneer Parachute Company improved the performance of the LeMoigne parachute in the paracommander (Figure 5-103), obtaining a glide ratio of 1.1 to 1.2, a high turn rate, and good landing control (References 5.143 and 5.144).
In 1972 the Naval Parachute Unit at El Centro, Calif., conducted extensive comparison tests with maneuverable personnel parachutes, including several types of blank-gore parachutes, the MC1-1B paratrooper parachute, and the paracommander. This program
documented the high performance of the paracommander parachute (Reference 5.145).
The development of maneuverable personnel parachutes was greatly accelerated by the ever-increasing popularity of sport jumping and by the desire to land manned and unmanned spacecraft on land rather than in the ocean.
The following requirements were established for maneuverable sport-jumper and spacecraft parachutes:
Sport Parachuting
5.1. A glide ratio LID of better than 1.5.
5.2. A turn rate of 3 seconds or less for a 180-degree turn.
5.3. A fast, uniform opening with opening forces limited to the equivalent of 10g or less.
Spacecraft Landing
5.1. Capability to glide toward and land in a preselected landing area.
5.2. Capability to land in ground winds up to 30 knots.
5.3. Capability to avoid such ground obstacles as roads and high power lines.
5.4. Capability to limit parachute opening forces to 3 to 4 g and landing impact forces to 4 g.
5.5. Capability to land in all weather, day and night.
These requirements, especially those for spacecraft landing, led to the development of a number of high-performance maneuverable parachutes. These include the Rogallo wing (parawing) developed by NASA, the cloverleaf parachute developed by Northrop, the ram-air inflated parafoil developed by D. C. Jalbert, the volplane developed by Pioneer, and the Barish sailwing. Three of these parachutes are shown in Figure 5-104.
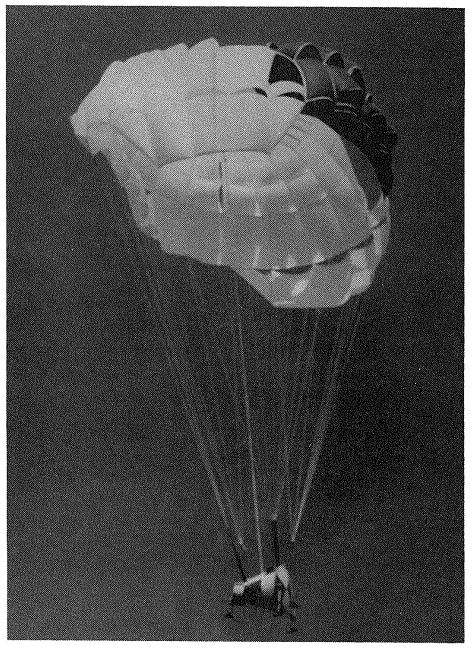
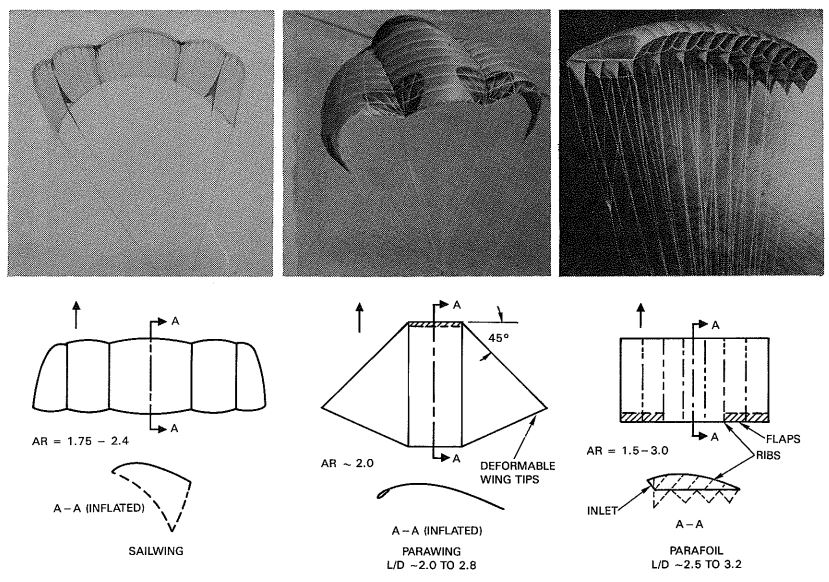
The cloverleaf parachute consists of a cluster of three parachutes combined into a single canopy, each with equal-length suspension lines. This arrangement of parachutes creates one parachute with an aspect ratio, AR, of about 2.0, reducing the induced drag and increasing the glide ratio. A rounded leading edge of the canopy is created by form ribs to avoid early flow separation and leading edge cave-in. Turn and landing control is obtained by alternate or simultaneous activation of two flaps on the trailing edges of the two rear canopy lobes. The canopy opens the same as a circular parachute. The use of imporous material results in a fast-opening parachute canopy and associated high opening forces. Northrop Corporation conducted an extensive development program on the cloverleaf parachute in the 1960s, starting with wind-tunnel model tests and ending with free-flight tests of a 56-foot-diameter parachute tested at 180 knots with a 3000-pound instrumented test vehicle. The cloverleaf parachute has a glide ratio up to 2.0 and good maneuver and landing capabilities. Opening forces can be limited to 4 g by use of multiple reefing, a somewhat complex method caused by the noncircular configuration of the canopy. References 5.146 and 5.147 give a detailed description of this development program.
The Rogallo wing or parawing is shown in Figure 5-104 in the twin-keel version. The canopy consists of two triangles in the single-keel version, and has a rectangular area between the two triangles in the twin-keel version. The twin-keel version can be equipped with rib-supported formed leading edges. Extensive development programs were conducted by industry, funded by NASA and the Air Force. Opening of the irregular-shaped canopy can be made uniform if controlled by multiple reefing. The single-keel version has a glide ratio L/D of 2.0 and the twin-keel version a glide ratio of 2.8. Deflection of the wing tips produces excellent maneuverability. The development programs included wind-tunnel model tests and flight tests of twin-keel parawings of up to 4000-square-foot wing area and 110-foot wingspan tested with vehicles weighing up to 6000 pounds. A design drawback is the variation in suspension-line length around the canopy and the resulting uneven line loads. The high opening force of the nonporous material canopy requires three-step reefing to meet the load limitations for spacecraft applications when deployed at an altitude of 18,000 feet and a dynamic pressure of 90 Failed to parse (SVG (MathML can be enabled via browser plugin): Invalid response ("Math extension cannot connect to Restbase.") from server "https://wikimedia.org/api/rest_v1/":): {\displaystyle lb/ft^2} (References 5.148 through 5.151).
The parafoil parachute, invented by D. Jalbert, consists of an all-flexible inflatable wing with an opening at the leading edge of the airfoil for ram-air inflation. For structural integrity and control of inflation, the wing is designed with individual cells (Figure 5-104). Suspension lines of equal length spanwise but various length cordwise give the wing an anhydral deflection, which provides stability and avoids end-cell collapse. Maneuverability is obtained by individual or simultaneous downward deflection of the outer trailing edges for turn or glide control (References 5.152 and 5.153). Opening forces are high because of the nonporous canopy material, similar to that of the parawing. (For a more detailed discussion of parawing and parafoil opening forces, see section 5.9.3). Sport parachutists use a suspension-line sliding keeper for opening-force control. Use of hi-glide parachutes for air vehicles and for aircraft escape requires multiple reefing. Lingard (References 5.154 and 5.155) provides a good analysis of parafoil aerodynamics, design, and performance. References 5.156 through 5.161 describe individual development programs.
Two other hi-glide parachutes that have demonstrated high glide and maneuver performance are the Pioneer-developed volplane parachute and the Barish sailwing (Reference 5.162).
5.9.2 Performance of Maneuverable Parachutes
Lift and Drag. Lift and drag of hi-glide parachutes can be analyzed in the same way lift and drag of low-aspect-ratio aircraft wings are analyzed. Figure 5-105, taken from section 4.5, shows the balance of forces on a ballistic and on a gliding parachute. A ballistic parachute has only drag; lift is required to make a parachute glide. The higher the ratio of lift to drag, the better is the glide performance. Selection of an airfoil with a good glide ratio is important in designing the ram-air inflated wing. Another important airfoil characteristic is noncritical stall behavior. The parasite drag of suspension lines, risers, payload (jumper), and other nonlift-producing parts of the parachute system must be included in calculating the expected glide ratio.
An aircraft pilot controls the aircraft attitude and velocity by using the elevator and engine power. This control is not possible on gliding parachutes because of the lack of power and the long distance between the center of aerodynamic forces in the canopy and the center of gravity of the total system. The gliding parachute flies with a fixed angle, called the trim angle, between the wing and the vertical of the wing-payload system. This angle is generally the angle of optimum glide. Changing the angle of attack as it can be changed in airplanes requires changing the attitude and length of the suspension lines during flight, which is technically very difficult. Several hi-glide parachutes use flaps for lift and limited glide control. Sport parachutists use this method for landing in a controlled stall, a skillful but also critical maneuver.
Figure 5-106 shows the Failed to parse (SVG (MathML can be enabled via browser plugin): Invalid response ("Math extension cannot connect to Restbase.") from server "https://wikimedia.org/api/rest_v1/":): {\displaystyle C_L/C_D} diagram and the associated glide ratios for four vehicle-gliding parachute systems using a cloverleaf, a twin-keel parawing, a ram-air inflated parafoil, and a rigid wing with a NASA 4424 airfoil, each having an aspect ratio of 2.0. The rigid-wing vehicle reaches a glide ratio of 6.8, the optimum condition for an unpowered glide system. The parafoil parachute system obtains a glide ratio of 3.2, the parawing 2.9, and the cloverleaf 1.9. These performance data have been confirmed in free-flight tests. For rigid wings as well as gliding parachutes, two points in the CL/CD diagram are of special interest: the point of optimum glide and the point of maximum lift. Most hi-glide parachutes are trimmed for the point of optimum glide, as are most aircraft.
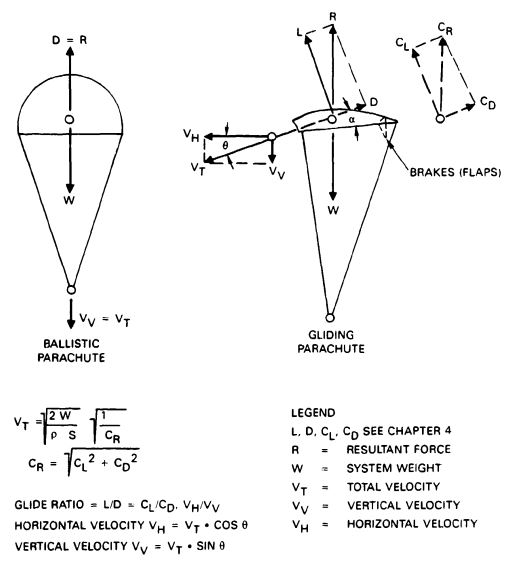
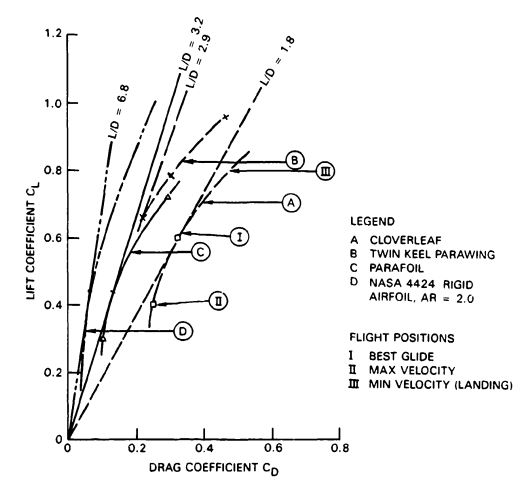
Increasing the wing (parachute) aspect ratio reduces the induced drag and increases the glide ratio. But a more slender wing requires more and longer suspension lines, which increases the parasite drag. Slender wings are more difficult to deploy, more critical in stall, and less maneuverable. An aspect ratio of 3 appears to be an optimum for high-performance parafoil parachutes.
Vehicle Parachute System Performance. Figure 5-107 shows the glide performance of cloverleaf, parawing, and parafoil vehicle systems versus parachute wing loading, W/S, where W is the weight of the total system and S the area of the parachute. S is the surface area of the single-surface cloverleaf and parawing parachutes and the one-sided area of the parafoil. The diagram assumes that the parachute can be flown over most of the angle-of-attack range investigated in wind-tunnel tests. In reality, as previously explained, gliding parachutes are designed for one trim angle, and angle-of-attack changes limited to those obtainable with flap deflection. This design provides a greater range on flap-equipped cloverleaf and parafoil parachutes than on parawings. The flight velocity changes with the square root of the wing loading. Any increase in wing loading slightly decreases the glide performance because of the proportionally larger increase in parasite drag. Spacecraft must be able to land in ground winds up to 30 knots; such a landing requires a high trajectory velocity and resultant high landing velocities.
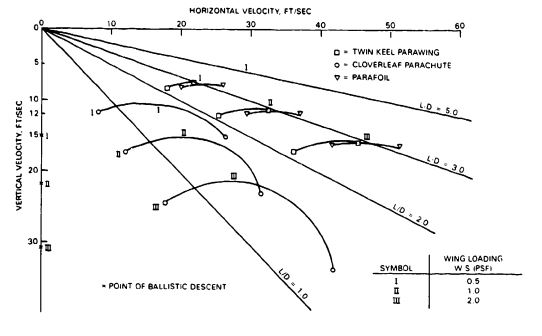
D. B. Goodrich of the U.S. Army Natick Laboratories has investigated the dynamic flight and landing performance of hi-glide parachute vehicle systems (Reference 5.163).
Turn Control and Landing. All hi-glide parachutes use alternate deflection of the wing tips (parawing) or alternate deflection of the trailing edge flaps (cloverleaf and parafoil) for turn control. This decreases lift and increases drag on the inside wing, causing bank and turn of the wing and providing excellent turn control on all gliding parachutes. However, banking of the wing increases the vertical velocity by the cosine of the bank angle; for this reason, a landing should be made in horizontal attitude and not in a bank. The dependency between bank angleand increase in vertical velocity is shown in Figure 5-108.
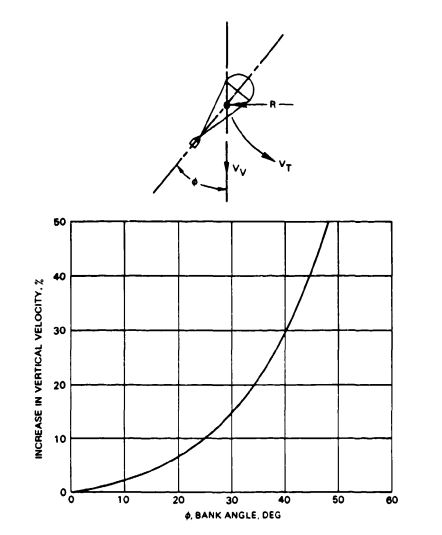
5.9.3 Opening Forces of HI-Glide Parachutes
All parachutes manufactured from low- or zero-porosity canopy material have higher opening forces than parachutes manufactured from standard material with porosities in the 100 to 150-Failed to parse (SVG (MathML can be enabled via browser plugin): Invalid response ("Math extension cannot connect to Restbase.") from server "https://wikimedia.org/api/rest_v1/":): {\displaystyle ft^3/ft^2/min} . Opening forces measured in free flight on large parawing parachutes were about 75% higher than those on equivalent area circular parachutes manufactured from standard material. These higher opening forces result in an opening-force coefficient, Failed to parse (SVG (MathML can be enabled via browser plugin): Invalid response ("Math extension cannot connect to Restbase.") from server "https://wikimedia.org/api/rest_v1/":): {\displaystyle C_x} , of 2.6 to 2.7 compared to a Failed to parse (SVG (MathML can be enabled via browser plugin): Invalid response ("Math extension cannot connect to Restbase.") from server "https://wikimedia.org/api/rest_v1/":): {\displaystyle C_x} , coefficient of 1.8 for circular flat and 1.05 for ribbon parachutes (see Figure 5-43). Force measurements conducted by the U.S. Navy on 350-Failed to parse (SVG (MathML can be enabled via browser plugin): Invalid response ("Math extension cannot connect to Restbase.") from server "https://wikimedia.org/api/rest_v1/":): {\displaystyle ft^2} parafoil parachutes showed about 70 to 75% higher opening forces than those measured on the standard 28-foot-diameter personnel parachute (Reference 5.157). These data are very similar to those obtained on the parawing. Only limited data are available on filling-time and drag-area increase versus time; more information is required for accurate force calculations.
The sliding keeper, the reefing device used on most sport-jumper parafoil (square) parachutes, cannot be analyzed precisely because of variation in gliding friction, radial forces, and related factors.
A cursory analysis of available data on unreefed hi-glide parachutes suggests a filling-time constant, n, of 5 to 6 for the filling-time formulation Failed to parse (SVG (MathML can be enabled via browser plugin): Invalid response ("Math extension cannot connect to Restbase.") from server "https://wikimedia.org/api/rest_v1/":): {\displaystyle t_f=\frac{D_on}{v}} . Force calculations that used a filling-time constant of 5.5 and where the drag-area-versus-time curve has a convex shape (see Figure 5-40, section 5.4) gave opening forces in good agreement with these measured in the Navy program.
For velocities in excess of 150 knots, hi-glide parachutes require positive, time-controlled reefing such as the skirt-reefing method. Three reefing steps were required on the 4000-Failed to parse (SVG (MathML can be enabled via browser plugin): Invalid response ("Math extension cannot connect to Restbase.") from server "https://wikimedia.org/api/rest_v1/":): {\displaystyle ft^2} parawing used for the recovery of a 6000-pound Apollo model with forces limited to 4g. In the Aircraft Gliding Escape System (AGES) Program, the U.S. Navy needed two-step reefing to limit the opening forces to the equivalent of 15 g for bail-out at 300 knots and a 15,000-foot altitude (Reference 5.161).
5.10 CLUSTERING OF PARACHUTES
5.10.1 General
A parachute cluster consists of two or more parachutes used to stabilize, decelerate, or lower a payload or air vehicle. Large 100-foot-diameter G-11 parachutes have been used in clusters of 10 parachutes, and small parachutes have been used in clusters of up to 20 parachutes (Reference 5.164).
Parachute clusters have the following advantages:
1. Several small parachutes are easier to fabricate, store, maintain, rig, handle, and retrieve than a single large parachute.
2. Clustering permits use of the same type of parachute for a large range of weights. Typical is the 100-foot G-11 cargo parachute, which is used for a weight range from 3000 pounds to over 50,000 pounds.
3. A parachute cluster has less probability of a catastrophic system failure than a single large parachute, an important consideration in the recovery of manned and unmanned air and space vehicles.
4. A parachute cluster provides a stable descent system even when using individual, high-drag, unstable parachutes.
5. A parachute cluster has a shorter filling time than a single large parachute.
Parachute clusters can also have the following disadvantages:
1. It is impossible to obtain a perfectly synchronized opening of all parachutes in a cluster. Because unsynchronized opening causes a lead/lag parachute situation, with lead parachutes having shorter filling times and higher individual parachute loads, each parachute in the cluster must be designed to handle the maximum individual load. Therefore, the total strength of the parachutes in a cluster and their associated weight and volume are higher than the weight and volume of a single large parachute of equivalent drag area.
2. Parachute clusters experience a reduction in drag because of interference and systems geometry.
3. Parachute clusters in which individual parachutes have long reefing times (6 to 10 seconds) may experience variation in disreef times because of cutter-time inaccuracies.
4. Using fast-opening parachutes in a cluster promotes the lead/lag parachute inflation situation, resulting in canopy blanketing, delayed opening, and high forces on individual parachutes.
5.10.2 Loss of Drag in Cluster Applications
Figure 5-109 illustrates a typical parachute cluster and shows two different kinds of suspension-line/riser arrangements.
Wind-tunnel tests show that parachutes combined into clusters suffer a reduction in drag because of the geometry of the cluster system, which forces parachutes to fly at a large angle of attack. Reduction in drag probably also occurs because of mutual interference. Long suspension lines or a suspension-line-riser combination decreases the individual angle of attack and thereby increases the cluster drag. This is demonstrated in Figure 5-110, taken from Reference 2.1, which shows the reduction in drag measured in free-flight tests of large-diameter parachutes plotted as drag-coefficient ratio versus number of parachutes in the cluster. The Sandia National Laboratories performed extensive wind-tunnel tests on clusters of up to eight ribbon and solid flat circular 15-inch-diameter model parachutes (Reference 5.165). The ribbon parachute data are also plotted in Figure 5-110 and agree amazingly well with the data obtained in free-flight tests on large parachutes. The Sandia test data on solid flat circular models, although not plotted in Figure 5-110, are in agreement with the ribbon parachute data.
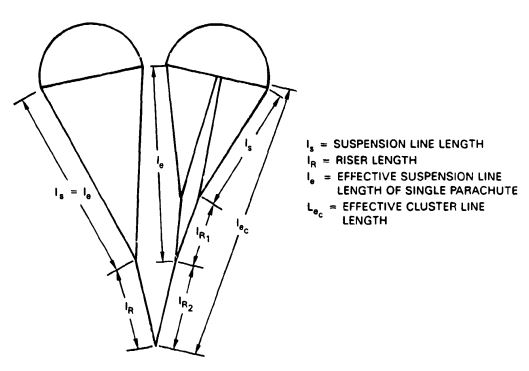
The lower group of large parachutes in Figure 5-110 consists of airdrop parachutes with short risers. The upper group, containing Apollo program parachutes, has an effective suspension-line/riser length, Failed to parse (SVG (MathML can be enabled via browser plugin): Invalid response ("Math extension cannot connect to Restbase.") from server "https://wikimedia.org/api/rest_v1/":): {\displaystyle L_{e_c}} ,as recommended by Brown.
Failed to parse (SVG (MathML can be enabled via browser plugin): Invalid response ("Math extension cannot connect to Restbase.") from server "https://wikimedia.org/api/rest_v1/":): {\displaystyle L_{e_c}=D_o\sqrt{n_c}}
where Failed to parse (SVG (MathML can be enabled via browser plugin): Invalid response ("Math extension cannot connect to Restbase.") from server "https://wikimedia.org/api/rest_v1/":): {\displaystyle n_c} is the number of parachutes in the cluster. Individual data measured on the Apollo parachute system were as follows:
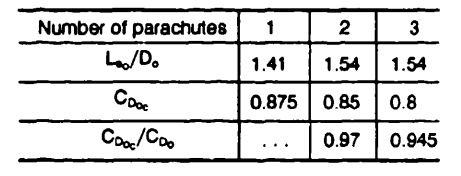
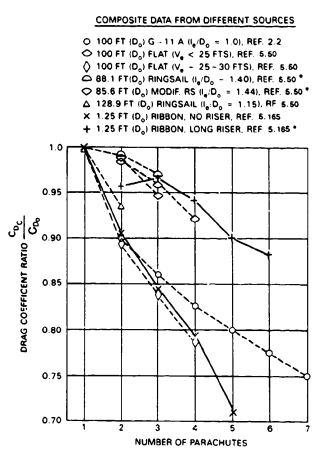
5.10.3 Operational Cluster Experience
Proper operation of a parachute cluster depends on the configuration of the vehicle to be recovered, the prudent selection of the best suited type of parachute, the number of parachutes in the cluster, the diameter of the individual parachute, the selected cluster geometry, and the canopy loading (rate of descent) of the cluster assembly. Canopy loading, Failed to parse (SVG (MathML can be enabled via browser plugin): Invalid response ("Math extension cannot connect to Restbase.") from server "https://wikimedia.org/api/rest_v1/":): {\displaystyle W/(C_DS)_p} , has a distinct effect on uniform, simultaneous canopy inflation and related opening forces. The cluster of three unreefed 24-foot-diameter ringslot parachutes used for extracting airdrop platforms opens uniformly with only small differences in parachute opening forces (Reference 5.166). The cluster of three unreefed ribbon landing deceleration parachutes for the B-70 bomber inflated uniformly with uniform loads.
A cluster of three 24-foot-diameter parachutes manufactured from 0.25-Failed to parse (SVG (MathML can be enabled via browser plugin): Invalid response ("Math extension cannot connect to Restbase.") from server "https://wikimedia.org/api/rest_v1/":): {\displaystyle oz/y^2} Mylar for a rate of descent of 5 ft/s would not operate properly. One or two parachutes inflated, but never all three. This difference in behavior is directly related to the canopy loading. The three platform extraction parachutes and the B-70 landing deceleration parachutes have a neglectable velocity drop during canopy inflation; therefore, sufficient dynamic pressure is available to inflate all three parachutes. When one of the three Mylar parachutes inflated ahead of the others, the velocity and dynamic pressure decreased so rapidly that the remaining pressure was insufficient to inflate the lag parachute(s).
Final-descent parachutes used for the airdrop of military equipment and the recovery of missiles and other air/space vehicles are generally in the 20 to 30-ft/s (0.4 to 1.0 Failed to parse (SVG (MathML can be enabled via browser plugin): Invalid response ("Math extension cannot connect to Restbase.") from server "https://wikimedia.org/api/rest_v1/":): {\displaystyle lb/ft^2} canopy loading) range. This parachute group requires reefing of the parachute canopy to obtain reasonable, uniform canopy opening and uniform opening forces.
Early airdrop of military equipment using clusters of unreefed parachutes resulted in very irregular parachute operation. Parachutes opened sequentially, not uniformly, producing high opening loads, noninflation of lag parachutes, and destruction of the farly inflating parachutes from overload. Reefing the individual parachutes in the cluster allowed all parachute canopies to obtain an initial reefed inflation followed by a reasonably uniform full inflation and inflation forces.
Reefing the individual parachutes made it possible to use parachute clusters for the recovery of equipment and manned and unmanned air and space vehicles (References 5.167 and 5.168).
The parachute cluster for the airdrop of military equipment uses a single or multiple parachute assembly for the extraction of the load platform. When the cluster is disconnected from the platform, the cluster lifts the main parachute bags off the platform and serves as pilot chute for the deployment of the main parachutes.
This deployment concept is not possible for the air vehicle shown in Figure 5-111. Extraction of the parachute bags from the vehicle compartment and parachute deployment by a single pilot chute would result in contact with the vertical stabilizer and would damage the parachute. In Figure 5-111, two pilot chutes were deployed by two drogue guns firing from the parachute compartment under 45 degrees upward, outward, and to the rear, providing for independent deployment of the two main parachute bags left and right of the vertical stabilizer (Reference 5.23).
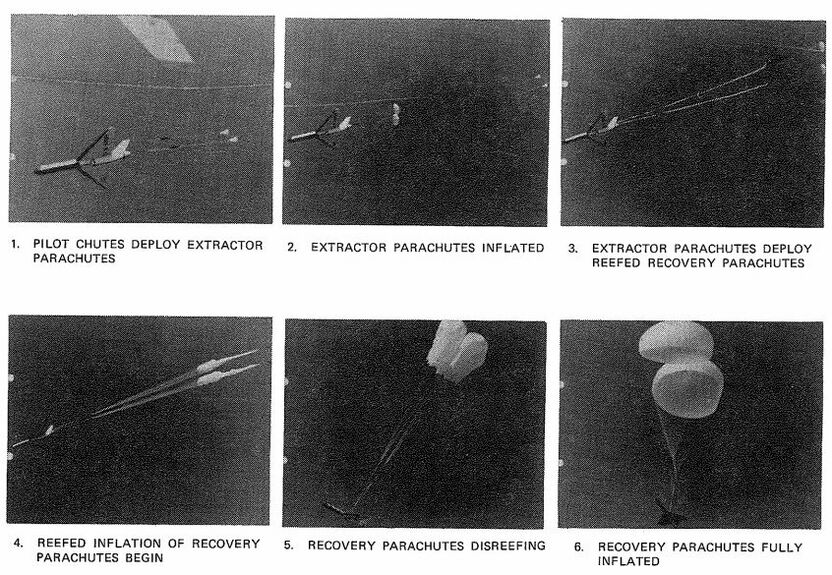
The parachute cluster of the Earth landing system for the Apollo command module was designed so that no single component failure could cause a catastrophic system failure. This requirement ruled out all single-connection points and necessitated individual attachments and deployment of the two ribbon drogue chutes and the three ringsail main parachutes from the unstable command module. This major analysis and design problem was made more difficult by the possibility of riser contact with the red-hot heat shield.
Use of the ringsail parachute for the Apollo landing system presented another problem. Ringsail parachutes tend to grow in the reefed stage, crowding out the lag parachute or parachutes, causing a large force difference at disreef, and requiring all parachutes to be designed to accommodate the higher forces. Locating a wide slot at the first reefed inflation stage limited the growth of the reefed canopy stages and made inflation and forces more uniform. A force sharing of 40-40-20 was the best uniformity that could be obtained on the Apollo parachute cluster.
The cluster of three 70-foot-diameter ringsail parachutes for the crew module of the B-1 bomber used the independent parachute deployment concept of the Apollo system at the start of the program, but similar nonuniform inflation problems occurred. Two pilot chutes over a common junction point were permanently attached with long bridles to each main parachute assembly, notably improving the uniform inflation and load sharing of the three main parachutes (References 5.169 and 5.170). The single-failure-point aspect of the junction of the two pilot chutes was accepted, because parachute recovery of the crew module is already the backup and not the primary system.
Slow-opening extended-skirt parachutes have proven to be more uniform in cluster inflation (see Figure 5-111).
Limited experience indicates the fast-opening ringsail parachutes may be preferable for clusters using parachutes in the 120 to 138-foot-diameter range. Large parachutes manufactured from standard-porosity material open very slowly, resulting in false vents,
canopy twisting, and other problems (References 5.14, 5.50, and 5.171).
Design, testing, operation, and problems with the cluster of three large ribbon parachutes for the water recovery of the solid-rocket boosters of the NASA space shuttle is discussed in considerable detail in papers presented at the 1979 AIAA conference on Aerodynamic Decelerator and Balloon Technology (see Reference 2.9).
As a rule, parachute clusters are stable assemblies even if the individual parachutes-such as circular flat, conical, or polyconical parachutes-are unstable. The moment coefficient graph (Figure 5-33) clearly shows that parachutes in a cluster operate at individual angles of attack where the destabilizing moment is close to zero. The dynamic stability of parachute cluster-vehicle systems is treated in References 5.172 and 5.173.
Detail design of parachute cluster assemblies is discussed in section 6.3.1. Additional cluster information is found in References 5.174 through 5.179.
5.11 FREQUENTLY USED FORMULAS IN PARACHUTE DESIGN
Dynamic Pressure
In equilibrium descent, parachutes descend at a constant dynamic pressure, q:
Failed to parse (SVG (MathML can be enabled via browser plugin): Invalid response ("Math extension cannot connect to Restbase.") from server "https://wikimedia.org/api/rest_v1/":): {\displaystyle q=\frac{\rho\ v^2}{2}} Failed to parse (SVG (MathML can be enabled via browser plugin): Invalid response ("Math extension cannot connect to Restbase.") from server "https://wikimedia.org/api/rest_v1/":): {\displaystyle (lbs/ft^2)}
where
v = velocity in ft/s
Failed to parse (SVG (MathML can be enabled via browser plugin): Invalid response ("Math extension cannot connect to Restbase.") from server "https://wikimedia.org/api/rest_v1/":): {\displaystyle \rho} = mass density of air at ambient altitude in Failed to parse (SVG (MathML can be enabled via browser plugin): Invalid response ("Math extension cannot connect to Restbase.") from server "https://wikimedia.org/api/rest_v1/":): {\displaystyle slugs/ft^3}
For velocity given in indicated air speed, dynamic pressure q can be calculated to
Failed to parse (SVG (MathML can be enabled via browser plugin): Invalid response ("Math extension cannot connect to Restbase.") from server "https://wikimedia.org/api/rest_v1/":): {\displaystyle q=\frac{V^2}{x}} Failed to parse (SVG (MathML can be enabled via browser plugin): Invalid response ("Math extension cannot connect to Restbase.") from server "https://wikimedia.org/api/rest_v1/":): {\displaystyle (lbs/ft^2)}
where x =
| V | knots | MPH | ft/s | km/h |
| x | 295.9 | 391.2 | 941.4 | 1013.1 |
If the dynamic pressure is given, the equilibrium velocity, v, is
Failed to parse (SVG (MathML can be enabled via browser plugin): Invalid response ("Math extension cannot connect to Restbase.") from server "https://wikimedia.org/api/rest_v1/":): {\displaystyle v=\sqrt{q\ x}}
For true airspeed, the dynamic pressure is
Failed to parse (SVG (MathML can be enabled via browser plugin): Invalid response ("Math extension cannot connect to Restbase.") from server "https://wikimedia.org/api/rest_v1/":): {\displaystyle q= \frac{v^2}{x}\sigma}
where
Failed to parse (SVG (MathML can be enabled via browser plugin): Invalid response ("Math extension cannot connect to Restbase.") from server "https://wikimedia.org/api/rest_v1/":): {\displaystyle \sigma = \frac{\rho}{\rho_o}}
and the true airspeed is
Failed to parse (SVG (MathML can be enabled via browser plugin): Invalid response ("Math extension cannot connect to Restbase.") from server "https://wikimedia.org/api/rest_v1/":): {\displaystyle v=\frac{\sqrt{q\ x}}{\sigma}}
Parachute Rate of Descent and Diameter
Failed to parse (SVG (MathML can be enabled via browser plugin): Invalid response ("Math extension cannot connect to Restbase.") from server "https://wikimedia.org/api/rest_v1/":): {\displaystyle v_e=\sqrt{\frac{2\ W_T}{C_{D_o}S_o\ \rho}}} , ft/s
where
Failed to parse (SVG (MathML can be enabled via browser plugin): Invalid response ("Math extension cannot connect to Restbase.") from server "https://wikimedia.org/api/rest_v1/":): {\displaystyle W_T} = weight of payload plus parachute assembly, lb
Failed to parse (SVG (MathML can be enabled via browser plugin): Invalid response ("Math extension cannot connect to Restbase.") from server "https://wikimedia.org/api/rest_v1/":): {\displaystyle C_{D_o}} = parachute drag coefficient related to so, dimensionless
Failed to parse (SVG (MathML can be enabled via browser plugin): Invalid response ("Math extension cannot connect to Restbase.") from server "https://wikimedia.org/api/rest_v1/":): {\displaystyle S_o} = canopy surface area = Failed to parse (SVG (MathML can be enabled via browser plugin): Invalid response ("Math extension cannot connect to Restbase.") from server "https://wikimedia.org/api/rest_v1/":): {\displaystyle \frac{\pi \ D_o^2}{4}} , Failed to parse (SVG (MathML can be enabled via browser plugin): Invalid response ("Math extension cannot connect to Restbase.") from server "https://wikimedia.org/api/rest_v1/":): {\displaystyle ft^2}
Failed to parse (SVG (MathML can be enabled via browser plugin): Invalid response ("Math extension cannot connect to Restbase.") from server "https://wikimedia.org/api/rest_v1/":): {\displaystyle v_e} = equilibrium velocity (rate of descent), ft/s
Failed to parse (SVG (MathML can be enabled via browser plugin): Invalid response ("Math extension cannot connect to Restbase.") from server "https://wikimedia.org/api/rest_v1/":): {\displaystyle \rho} = mass density of air at desired altitude, Failed to parse (SVG (MathML can be enabled via browser plugin): Invalid response ("Math extension cannot connect to Restbase.") from server "https://wikimedia.org/api/rest_v1/":): {\displaystyle slugs/ft^3}
For a given system weight, Failed to parse (SVG (MathML can be enabled via browser plugin): Invalid response ("Math extension cannot connect to Restbase.") from server "https://wikimedia.org/api/rest_v1/":): {\displaystyle W_T} ; a required rate of descent, Failed to parse (SVG (MathML can be enabled via browser plugin): Invalid response ("Math extension cannot connect to Restbase.") from server "https://wikimedia.org/api/rest_v1/":): {\displaystyle V_e} , at an altitude with the density, Failed to parse (SVG (MathML can be enabled via browser plugin): Invalid response ("Math extension cannot connect to Restbase.") from server "https://wikimedia.org/api/rest_v1/":): {\displaystyle \rho} , and using a parachute with a known drag coefficient, Failed to parse (SVG (MathML can be enabled via browser plugin): Invalid response ("Math extension cannot connect to Restbase.") from server "https://wikimedia.org/api/rest_v1/":): {\displaystyle C_{D_o}} , the required nominal parachute diameter is obtained by
Failed to parse (SVG (MathML can be enabled via browser plugin): Invalid response ("Math extension cannot connect to Restbase.") from server "https://wikimedia.org/api/rest_v1/":): {\displaystyle D_o=\sqrt{\frac{2.547\ W_T}{C_{D_o}\ v_e^2\ \rho}}} ft
The following simplified formulas can be used for determining parachute diameter and rate of descent at any altitude:
Failed to parse (SVG (MathML can be enabled via browser plugin): Invalid response ("Math extension cannot connect to Restbase.") from server "https://wikimedia.org/api/rest_v1/":): {\displaystyle D_o=\frac{\sqrt{W_T}}{v_{eo}}\ y\ \sqrt{\frac{\rho _o}{\rho}}} and Failed to parse (SVG (MathML can be enabled via browser plugin): Invalid response ("Math extension cannot connect to Restbase.") from server "https://wikimedia.org/api/rest_v1/":): {\displaystyle v_{eo} = \frac{\sqrt{W_T}}{D_o}\ y\ \sqrt{\frac{p_o}{\rho}}}
The factor y as a function of parachute drag coefficient, Failed to parse (SVG (MathML can be enabled via browser plugin): Invalid response ("Math extension cannot connect to Restbase.") from server "https://wikimedia.org/api/rest_v1/":): {\displaystyle C_{D_o}} is plotted in Figure 5.112, and the density ratio, Failed to parse (SVG (MathML can be enabled via browser plugin): Invalid response ("Math extension cannot connect to Restbase.") from server "https://wikimedia.org/api/rest_v1/":): {\displaystyle \sigma} , is plotted in Table 3-3.
For sea-level conditions
Failed to parse (SVG (MathML can be enabled via browser plugin): Invalid response ("Math extension cannot connect to Restbase.") from server "https://wikimedia.org/api/rest_v1/":): {\displaystyle \sqrt{\frac{\rho _o}{\rho}}=1.0}
If Failed to parse (SVG (MathML can be enabled via browser plugin): Invalid response ("Math extension cannot connect to Restbase.") from server "https://wikimedia.org/api/rest_v1/":): {\displaystyle V_{e_{o}}} is the sea-level rate of descent, then the rate of descent, Failed to parse (SVG (MathML can be enabled via browser plugin): Invalid response ("Math extension cannot connect to Restbase.") from server "https://wikimedia.org/api/rest_v1/":): {\displaystyle V_e} , at any altitude is
Failed to parse (SVG (MathML can be enabled via browser plugin): Invalid response ("Math extension cannot connect to Restbase.") from server "https://wikimedia.org/api/rest_v1/":): {\displaystyle V_e=V_{e_o}\frac{1}{\sqrt{\frac{\rho}{\rho _o}}}=V_{e_o}\cdot \frac{1}{\sqrt{\sigma}}}
To convert from rate of descent at altitude Failed to parse (SVG (MathML can be enabled via browser plugin): Invalid response ("Math extension cannot connect to Restbase.") from server "https://wikimedia.org/api/rest_v1/":): {\displaystyle x_1} to rate of descent at altitude Failed to parse (SVG (MathML can be enabled via browser plugin): Invalid response ("Math extension cannot connect to Restbase.") from server "https://wikimedia.org/api/rest_v1/":): {\displaystyle x_2} ,
Failed to parse (SVG (MathML can be enabled via browser plugin): Invalid response ("Math extension cannot connect to Restbase.") from server "https://wikimedia.org/api/rest_v1/":): {\displaystyle V_{e_{_x{_2}}}=V_{e_{_x{_1}}}\sqrt{\frac{\sigma _{x_1}}{\sigma _{x_2}}}}
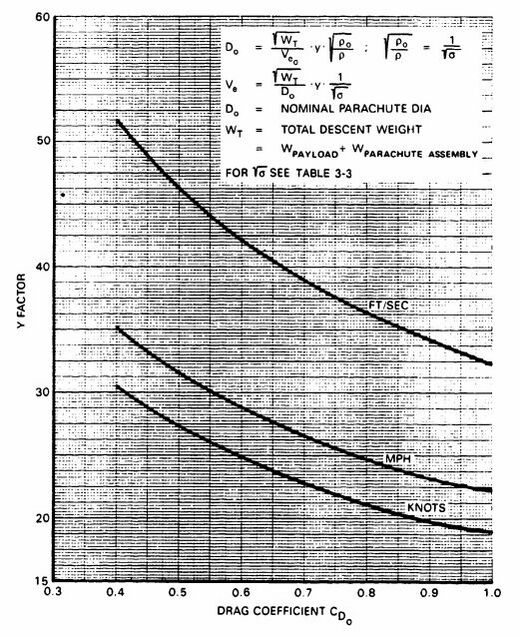
5.12 REFERENCE MATERIAL
5.1. U.S. Air Force. Model Parachutes; Comparison Tests of Various Types, by T. W Knacke and A. M. Hegele. USAF, January 1949. (USAF Report MCREXE-672-12B.)
5.2. T W Knacke. Unpublished results of tests conducted by the U.S. Air Force 6511th Test Group (Parachutes), El Centro, Calif., 1953.
5.3. T. W Knacke. Unpublished results of drop tests conducted with 1-meter Failed to parse (SVG (MathML can be enabled via browser plugin): Invalid response ("Math extension cannot connect to Restbase.") from server "https://wikimedia.org/api/rest_v1/":): {\displaystyle D_o} model parachutes in a controlled environment, 1943.
5.4. U.S. Air Force. Drop Tests of 16,000 Failed to parse (SVG (MathML can be enabled via browser plugin): Invalid response ("Math extension cannot connect to Restbase.") from server "https://wikimedia.org/api/rest_v1/":): {\displaystyle In^2} Model Parachutes, Summary Report, Volume VII, by J. F. Stimmler and R. J. Ross. USAF, April 1960. (USAF Report AF-TR-5867.)
5.5. _____. Effects of Line Length and Number of Panels of a Flat, Circular Parachute, by P. R. Doty. USAF (USAF Report TSEAC14-672-3-3-4.)
5.6. Royal Aircraft Establishment. The Effect of Various Factors on Parachute Characteristics, by T F. Johns and E. I. Auterson. RAE, Farnborough, England, January 1944. (R&M 2335.)
5.7. U.S. Air Force. The Drag of Cones, Plates and Hemispheres in the Wake of a Forebody in Subsonic Flow, by H. G. Heinrich and E. L. Haak. USAF, December 1961. (USAF Report ASD-TR-61-587.)
5.8. _____. Drag Characteristics of Plates, Cones, Spheres and Hemispheres in the Wake of a Forebody in Transonic and Supersonic Flow, by H.G. Heinrich and R. S. Hess. USAF, December 1964. (USAF Report RTD-TDR-63-4242.)
5.9. B. Dayman, Jr. and D. W Kurtz. "Forebody Effects on Drogue Drag in Supersonic Flow." AIAA Paper, January 1968. (AIAA 68-8.)
5.10. T W Knacke. "The Apollo Parachute Landing System." Paper presented at the AIAA Aerodynamic Deceleration Systems Conference, El Centro, Calif., April 1968. (USAF Report FTC-TR-69-11.)
5.11. U.S. Air Force. Wind Tunnel Tests for Defining the Parachute Retardation System for the Ejectable Nose Section of the XS-2 Research Aircraft, by T W Knacke. USAF, June 1981. (USAF Report AFWAL-TM-81-130.)
5.12. C. W Peterson and D. W Johnson. "Reduction in Parachute Drag Due to Forebody Wake Effect." AIAA Paper. (AIAA 81-1939.)
5.13. U.S. Air Force. Development Tests of a Low Altitude, High Speed Escape Parachute, by I. Rosenberg. USAF (USAF Report FTC-TN-58-11.)
5.14. U.S. Air Force. 200-Ft-Diameter Solid Flat Parachute, Engineering Tests, by C. R. Graham. USAF, 6511th Parachute Development Test Group. February 1954. (USAF Technical Note FTL-54-1.)
5.15. National Parachute Test Range. Results of Parachute Opening Force Test Program, by J. W Dahnke, J. E Palmer, C. L. Ewing. NPTR. (Technical Report 2-76.)
5.16. U.S. Air Force. G-11A Parachute Ultimate Drop Test Conditions, by C. R. Graham. USAF, September 1954. (USAF Report FTL-TN.54-23.)
5.17. _____. High Altitude and Air Speed Tests of Standard Parachute Canopies, by H. E Freeman and I. Rosenberg. USAF, October 1958. (USAF Report AFFTC-TR-58-32.)
5.18. _____. Performance Evaluation of Pioneer 23-Ft-Failed to parse (SVG (MathML can be enabled via browser plugin): Invalid response ("Math extension cannot connect to Restbase.") from server "https://wikimedia.org/api/rest_v1/":): {\displaystyle D_o} Triconical Personnel Parachute, by C. W Fisher. USAF, July 1969. (USAF Report AFFTC-TR-69-28.)
5.19. Anonymous Pioneer Report. Summary Report on the Pioneer l00-Ft-Failed to parse (SVG (MathML can be enabled via browser plugin): Invalid response ("Math extension cannot connect to Restbase.") from server "https://wikimedia.org/api/rest_v1/":): {\displaystyle D_o} Triconical Parachute. 1966. (Pioneer Report H-6014.)
5.20. W Everett. "Development of an Improved Midair Retrieval Parachute System for Drone/RPV Aircraft." AIAA Paper. (AIAA 73-469.)
5.21. U.S. Naval Parachute Unit. Test and Evaluation of a 26-Ft. Extended Skirt Personnel Parachute Canopy, by H. R. Moy. USNPU, El Centro, Calif. (USNPU Technical Report 6-52.)
5.22. U.S. Air Force. Test of Canopy, Extended Skirt Design (T-10), by H. R. Engel. USAF, May 1952. (USAF Report TN WCLE-52-16.)
5.23. _____. Design Analysis of Final Recovery Parachutes for B- 70 Encapsulated Seat and the USD-5 Drone, by T W Knacke and L. L. Dimmick. USAF, April 1%2. (USAF Report ASD-TDR-62.75.)
5.24. _____. 67.3-Ft. Nominal Diameter Fully Extended Skirl Parachute, by K. W Stevenson. USAF, April 1955. (USAF Report FTC-TN-55-9.)
5.25. Naval Ordnance Laboratory. Model Parachute Wind Tunnel Tests of Several Different Types, by G. L. Fogel. NOL, October 1954. (NOL TM 2872.)
5.26. U.S. Air Force. Technical Evaluation of the French 'Cross' Parachute, by C. E. Grinstoff. USAF, August 1963. (USAF Technical Memorandum ASTM-63-1.)
5.27. _____. Drag and Stability of the Cross Type Parachute, by R. J. Niccum and E. L. Haak, University of Minnesota. USAE February 1965. (USAF Report AFFDL-TER-64-155.)
5.28. Naval Ordnance Laboratory. Effect of Canopy Geometry on the Drag Coefficient of a Cross Parachute in the Fully Open and Reefed Condition for a W/L Ratio of 0. 264, by W P. Ludtke. NOL, August 1971. (NOL TR 71-111.)
5.29. Naval Surface Warfare Center. Effect of Canopy Geometry and Cloth Permeability on Drag Coefficient of a Cross Parachute in the Fully Open and Reefed Condition for a W/L Ratio of 0.3, by W P. Ludtke. NSWC, February 1982. (NSWC TR 81-441.)
5.30. Naval Ordnance Laboratory. Effects of Canopy Geometry on the Infinite Mass Opening Shock of a Cross Parachute With a W/L Ratio of 0.264, by W P. Ludtke. NOL, July 1973. (NOL TR 73-157.)
5.31. _____. Effects of Canopy Geometry on the Spinning Characteristics of a Cross Parachute with a W/L Ratio of 0.264, by W P. Ludtke. NOL, June 1972. (NOL TR 72-145.)
5.32. Naval Surface Warfare Center. Wind Tunnel Measurements of the Variation of Suspension Line Forces in a Cross Parachute, by W P. Ludtke. NSWC, May 1990. (NSWC TR 89-306.)
5.33. U.S. Air Force. Evaluation of the 73-Foot-Diameter Paraform Recovery Parachute System, by R. S. Morrison. USAF, December 1979. (USAF Report AFFTC-TR-79-30.)
5.34. D. F Jorgenson and D. J. Cockrell. 'Aerodynamics and Performance of Cruciform Parachutes." AIAA Paper, October 1981. (AIAA 81-1919.)
5.35. C. Q. Shen and D. J. Cockrell. 'Aerodynamic Characteristics of Flow Around Cross Parachutes in Steady Motion." AIAA Paper, October 1986. (AIAA 86-2458 CP.)
5.36. U.S. Air Force. Parachute Airfoil Type, Design and Construction, by W, C. Buhler. USAF, October 1947. (USAF Report TSEPE-672-19S.)
5.37. _____. Feasibility Study of a Universal Aerial Recovery System, Volumes I and 11, by E. G. Ewing and J. Vickers. USAF, April 1966. (USAF Report SSD-TR-66-47.)
5.38. P. R. Delurgio, B. A. Engstrom, and W C. Buhler. "The Mid-Air Retrieval System for the Air-Launched Cruise Missile." AIAA Paper, October 1981. (AIAA 81-1915.)
5.39. U.S. Air Force. Design, Use and Construction of FIST Type Parachutes, by T W Knacke. USAF, June 1948. (USAF Report MCREXE-672-19LL.)
5.40. _____. Sample Calculation for a Deployable Aerodynamic Decelerator, by R. J. Berndt and J. H. Dewesse. USAE (USAF Report FDFR-TM-63-20.)
5.41. D. F. McVey, W B. Pepper, and J. F Reed. 'A Parametric Wind Tunnel Study of Ribbon Parachutes." AIAA Paper, November 1975. (AIAA 75-1370.)
5.42. R. C. Maydew and D. W Johnson. "Supersonic and Transonic Deployment of Ribbon Parachutes at Low Altitudes." AIAA Journal of Aircraft, Vol. 9, No. 7, July 1972.
5.43. Sandia National Laboratories. Parachute Design and Performance for Supersonic Deployment and for the Recovery of Heavy Loads, by W B. Pepper. SNL, September 1969. (SNL Report SC-DC-69-1883.)
5.44. _____. Design and Development of a Three-Stage Parachute System for Low Level Deployment at Mach 1.2, by W B. Pepper. SNL, May 1967. (SNL Report SC-DR-66-2707.)
5.45. _____. Design and Development of a Heavy Duty 76-Ft Ribbon Parachute, by I. T Holt. SNL, September 1968. (SNL Report SC-R-68-1793.)
5.46. D. F McVey and D. F Wolf. 'Analysis of Deployment and Inflation of Large Ribbon Parachutes." ATAA Paper, May 1973. (AIAA 73451.)
5.47. D. W Johnson and C. W Peterson. "High-Speed, Low-Altitude Delivery Using a Single Large Ribbon Parachute." AIAA Paper, September 1984. (AIAA 84-0803.)
5.48. U.S. Naval Parachute Unit. 34-Foot Ringslot Parachute for Marine Resupply Container, by W C. Buhler. USNPU, El Centro, Calif, July 1954. (USNPU Technical Report 4-54.)
5.49. U.S. Air Force. Performance Evaluation of a Cluster of Two 28-Foot Do Ringslot Extraction Parachutes Towed from a C-130 Aircraft, by W L. Brown and H. J. Hunter. USAF, September 1965. (USAF Report AFFTC-TR-65-25.)
5.50. _____. Ringsail Parachute Design, by E. G. Ewing. USAF, January 1972. (USAF Report AFFDL-54-72-3.)
5.51. _____. Performance of Trailing Aerodynamic Decelerators at High Dynamic Pressure, by B. A. Engstroem. USAF, January 1958. (USAF Report WADC-TR-58-284.)
5.52. _____. Investigation of F-111 Crew Module Stabilization Parachute (Hemisflo) Model at Mach Numbers of 0.5, 2.0, and 2.5, by L. L. Galagher. USAF. April 1960. (USAF Report AEDC.TR-65-83.)
5.53. _____. Parachutes, Guide Surface (Ribbed Type), by H. G. Heinrich. USAF, February 1948. (USAF Report MCREXE-672-25F)
5.54. Royal Aircraft Establishment. The Design and Performance of the Ribless Guide Surface Parachute, by G. G. Gale. RAE, Farnborough, England, November 1962. (Mech. Eng. Technical Note 362.)
5.55. H. N. Murrow and C. V. Eckstroem. "Description of a New Parachute for Use With Meteorological Rockets." Paper presented at the AIAA Sixth Conference on Applied Meteorology.
5.56. R. D. Moog and Assoc. "Qualification Flight Test of the Viking Decelerator System (DGB Parachute)." AIAA Paper, May 1973. (AIAA 73-457.)
5.57. Radioplane. Aerodynamic Appraisal of the Rotafoil Parachute, by A. Giffrin. Radioplane, March 1952. (Report 663.)
5.58. National Aeronautics and Space Administration. Drag Characteristics of a Rotary Parachute (Vortex Ring) Tested in a Vertical Wind Tunnel, by S. M. Burk, Jr. NASA, Langley 1962. (NASA Report D-1388.)
5.59. W B. Pepper. "New High Performance Rotating Parachute." AIAA Paper, April 1984. (AIAA 84-0808.)
5.60. U.S. Air Force. Some Research Efforts Related to Problems of Aerodynamic Retardation, by H. G. Heinrich. USAF, November 1960. (USAF Report WADD-TN.60-276.)
5.61. _____. Stability and Drag of Parachutes With Varying Effective Porosities, by H. G. Heinrich and E. L. Haak. USAF. (USAF Report ADS-TDR-62-100.)
5.62. Naval Surface Weapons Center. A View on the Cause of Parachute Instability, by W. P. Ludtke. NSWC, May 1983. (NSWC TR 83-28.)
5.63. Royal Aircraft Establishment. Descent Characteristics of Parachutes, by H. Henn. RAF translation of German Report ZWE/UM/6202, October 1944. RAE, Farnborough, England.
5.64. F M. White and D. F Wolf. 'A' Theory of Three-Dimensional Parachute Stability." AIAA Journal of Aircraft, Vol. 5, No. 1, January-February 1968.
5.65. D. F. Wolf. "The Dynamic Stability of a Nonrigid Parachute Payload System." AIAA Journal of Aircraft, Vol. 8, pp. 604-609, August 1971.
5.66. D. J. Cockrell, C. 0. Shen, R. J. Harwood, and A. C. Baxter. 'Aerodynamic Forces Acting on Parachutes in Unsteady Motion and the Consequential Dynamic Stability Characteristics." AIAA Paper, October 1986. (AIAA 86-2470 CP)
5.67. K. F. Doherr and C. Saliaris. "On the Influence of Stochastic and Acceleration Dependent Aerodynamic Forces on the Dynamic Stability of Parachutes." AIAA Paper, October 1981. (AIAA 81-1941.)
5.68. M. Neustadt, et al. 'A Parachute Recovery System Dynamic Analysis." Journal of Spacecraft and Rockets, Vol. 4, No. 3, March 1967.
5.69. National Advisory Committee for Aeronautics. Parachutes for Aircraft, by W Mueller. NACA, October 1927. (NACA TM-450.)
5.70. E N. Scheubel. "Notes on the Opening Shock of a Parachute." Progress Report IRE-65, April 1946, Foreign Exploitation Section, Intelligence (T-2).
5.71. E O'Hara. "Notes on the Opening Behavior and the Opening Forces of Parachutes." Royal Aeronautical Society Journal, Vol. 53, November 1949. Pp. 1053-1062.
5.72. Northrop Corp. Theoretical Investigation of the Parachute Inflation Process, by L. W Rust. Northrop Corp., Ventura Division, July 1965. (Report NVR-3887.)
5.73. U.S. Air Force. Analysis of Parachute Opening Dynamics With Supporting Wind Tunnel Experiments, by H. G. Heinrich and R. A. Norem. Proceedings of the 1969 Aerodynamic Deceleration Systems Conference. USAF. (USAF Report FTC-TR-69-11.)
5.74. D. F Wolf. 'A Simplified Dynamic Model of Parachute Inflation." AIAA Paper, October 1973. (AIAA 73-540.)
5.75. J. W, Purvis. "Theoretical Analysis of Parachute Inflation Including Fluid Kinetics." AIAA Paper, October 1981. (AIAA 81-1925.)
5.76. E. Pflanz. Determination of the Decelerating Forces During the Opening of Cargo Parachutes. ATI 26111, July 1942. USAF translation of German Report FGZ 231.
5.77. _____. Retarding Forces During Unfolding of Cargo Parachutes. ATI 20126, September 1943. USAF translation of German Report FGZ 331.
5.78. A. J. McEwen. 'An Investigation of Parachute Opening Loads, and a New Engineering Method for Their Determination." AIAA Paper, September 1970. (AIAA 70-1168.)
5.79. Northrop Corp. Investigation of Prediction Methods for the Loads and Stresses of Apollo Type Spacecraft Parachutes, Volume I, by E. E. Mickey, A. J. McEwen, E. G. Ewing, E. C. Huyler, and B. Khajeb-Nouri. Northrop Corp., Ventura Division, June 1970. (Report NVR-6431.)
5.80. U.S. Air Force. The Initial Phase of Parachute Inflation, by K. E. French, Lockheed Aircraft Corp. Proceedings of the 1968 Aerodynamic Deceleration Systems Conference, El Centro, Calif. USAF, September 1968. (USAF Report FTC-69-11.)
5.81. Lockheed Aircraft Corp. A Method for Determining Parachute Opening Shock Forces, by D. L. Schilling. LAC, August 1957. (LAC Report 12543.)
5.82. G. C. Greene. "Opening Distance of a Parachute." Journal of Spacecraft and Rockets, Vol. 7, No. 1, January 1970.
5.83. Naval Surface Weapons Center. Notes on a Generic Parachute Opening Force Analysis, by W. P. Ludtke. NSWC, March 1986. (NSWC TR 86-142.)
5,84. Naval Surface Weapons Center. Notes on a Theoretical Parachute Opening Force Analysis Applied to a General Trajectory, by W P Ludtke. NSWC, May 1988. (NSWC TR 88-6.)
5.85. K E. French. "Model Laws for Parachute Opening Shock." AL4A Journal, Vol. 2, No. 12, December 1964. Pp. 2226-2228.
5.86. J. W Purvis. "Prediction of Parachute Line Sail During Lines-First Deployment." Journal of Aircraft, Vol. 20, November 1983. Pp. 940-945.
5.87. U.S. Air Force. Performance of the BA-18, BA-18 With Spreading Gun and B-25 Parachute Assemblies, by S. O. Hammond and R. D. Woolman. USAF, November 1976. (USAF Report AFFTC-TR-76-34.)
5.88. Naval Weapons Center. "Parachute Suitability Study for Navy Aircrew Common Escape System (NACES)." NWC, China Lake, Calif., July 1984. (Aerosystems Department Memorandum.)
5.89. D. B. Webb. "Development and Initial Test Results of a Parachute With Automatic Inflation Modulation (AIM)." AIAA Paper, March 1979. (AIAA 79-0467.)
5.90. U.S. Air Force. Evaluation of Opening Characteristics, A.I.M. Parachute, Phase land Hl and Addendum, by T J. Brosnahan. USAF, October 1981. (USAF Report AFFTC-TR-80-20.)
5.91. _____. Evaluation of Opening Characteristics, Automatic Inflation Modulation Parachute, Phase III, by T J. Brosnahan. USAF, September 1982. (USAF Report AFFTC-TR-82-15.)
5.92. Naval Weapons Center. GQ Aeroconical Personnel Maneuverable, Gliding Parachute Assembly, Type 1000, by G. Menard. NWC, China Lake, Calif., December 1981. (NWC TP 6296.)
5.93. W Chagaris. Data furnished by the Douglas Aircraft Co., Long Beach, Calif., on ACES II main parachute tests, basic and B-i tests, February 1985.
5.94. U.S. Air Force. 28-Ft Standard Back Style Parachute Quarter Deployment Bag Comparison Test, by Brooks. USAF, March 1952. (USAF Report AFFTC-TN-52-2.)
5.95. _____. Performance Data for Four, Free-Type, Back-Style Automatic Personnel Parachute Assemblies, by R. D. Woolman. USAF, January 1975. (USAF Report AFFTC-TR-74-35.)
5.96. U.S. Army Air Corps. The Magnitude and Duration of Parachute Opening Shock at Various Altitudes and Air Speeds, by G. A. Hallenbeck. USAAC, Engineering Division, July 1944. (Report ENG-49-696-66.)
5.97. U.S. Air Force. High Altitude and High Airspeed Tests of Standard Parachute Canopies, by H. F. Freeman and I. Rosenberg. USAF, October 1958. (USAF Report AFFTC-TR-58-32.)
5.98. U.S. Air Force. 67.3-Ft. Do, Fully Extended Skirt Parachute, Drop Tests, by K. W Stevenson. USAF, April 1955. (USAF Report AFFTC-TN-55-9.)
5.99. T W, Knacke. "High Altitude Parachute Recovery." Paper presented at the 1952 Symposium on Physics and Medicine of the Upper Atmosphere. Reprinted as "Physics and Medicine of the Upper Atmosphere." Univ. of N. Mex. Press, 1952.
5.100. Royal Aircraft Establishment. The Use of Parachutes at High Speeds and High Altitude, by M. H. L. Waters and A. C. Browning. RAE, Farnborough, England, August 1961. (Mech. Eng. Technical Note 340.)
5.101. U.S. Air Force. Summary of Experimental Results Obtained From the NASA Planetary Entry Parachute Program, by H. N. Murrow and J. C. McFall, Jr., NASA, Langley. Paper presented at the 1968 Aerodynamic Deceleration Systems Conference, El Centro, Calif. USAF, September 1968. (USAF Report FTC-69-11.)
5.102. W B. Pepper and J. F Reed. "Parachute Study of Pressure Distribution in Wind Tunnel Testing," Journal of Aircraft, Vol. 10, No. 11. Pp. 895 to 900, November 1976.
5.103. Naval Ordnance Laboratory. Effects of Canopy Geometry on the Infinite Mass Opening Shock of a Cross Parachute With a WIL Ratio of 0.264, by W P. Ludtke. NOL, July 1973. (NOL TR 73-157.)
5.104. U.S. Air Force. Reefing Methods, Parachutes, by T W Knacke. USAF, October 1947. (USAF Report TSEPE-672-25D.)
5.105. Royal Aircraft Establishment. Some Wind Tunnel Experiments on the Reefing of Parachutes, by M. H. L. Waters and D. B. Cobb. RAE, Farnborough, England, November 1963. (Mech. Eng. Technical Note 329.)
5.106. M. W Higgins. "Recovery System Preliminary Design. A Simplified Approach to Determining Drogue Chute Staging, Timing, and Altitude Requirements." AIAA Paper, March 1979. (AIAA 79-0446.)
5.107. U.S. Air Force. Controlled Opening Parachute (Schade), by D. Gold. U.S. Air Force 6511th Test Group (Parachutes), El Centro, Calif., 1956. (USAF Report TN-56-1.)
5.108. _____. The University of Kentucky Continuous Disreefing Device, by J. E Lafferty and K O. Lange. USAF, May 1959. (USAF Report WADC TN 58-177.)
5.109. _____. Determination of the Aerodynamic Drag and Static Stability of Reefed Parachute Canopies, by A. P. Riffle. USAF, January 1965. (USAF Report AFFDL-TR-64-164.)
5.110. _____. Reefing of Parachutes-Drag Area Ratios Versus Reefing Line Ratios, by T W Knacke. USAF, July 1976. (USAF Report ASD-TR-76-2.)
5.111. R J. Bobbitt, R. J. Mayhue, G. L. Faurote, and L. L. Galigher. "Supersonic and Subsonic Wind Tunnel Tests on Reefed and Unreefed Disk-Gap-Band Parachutes." AIAA Paper, September 1970. (AIAA 70-1172.)
5.112. D. F Wolf and R. H. Croll. "Wind Tunnel Measurements of Dynamic Reefing Line Tension in Ribbon Parachutes." AIAA Paper, March 1979. (AIAA 79-465.)
5.113. U.S. Air Force. Reefing of Parachutes-Forces in Reefing Line, by T W Knacke. USAF, October 1981. (USAF Report ASD-TR-81-5029.)
5.114. W M. Pepper and J. F Reed. "Parametric Study of Parachute Pressure Distribution by Wind Tunnel Testing." AIAA Paper. (AIAA 75-1366.)
5.115. U.S. Air Force. Pressure Distribution During Parachute Inflation Phase I, Infinite Mass Opening Case, by H. D. Melzig and P. K. Schmidt. USAF, March 1966. (USAF Report AFFDL-TR-66-110.)
5.116. Pressure Distribution During Parachute Opening, by H. D. Melzig and C. Salaris. USAF, February 1969. (USAF Report AFFDL-TR-68-135.)
5.117. Sandia National Laboratories. Pressure and Profile Data of 20* Conical Ribbon Parachutes, Volumes I and 11, by H. G. Heinrich. SNL, May 1977. (SNL Report 77-7005.)
5.118. Northrop Corp. Investigation of Prediction Methods for the Loads and Stresses of Apollo Type Spacecraft Parachutes, Volume II Stresses, by W M. Mullins, D. T. Reynolds, K. G. Lindh, and M. R. Bottorf. Northrop Corp., Ventura Division, June 1970. (NVR-6432.)
5.119. J. E Henfling and J. W Purvis. "Pressure Distribution on Parachute Ribbon Shapes." AIAA Paper, September 1984. (AIAA 84-0815.)
5.120. K. K. Muramoto and W L. Garrard. "Method for Calculating the Pressure Field About a Ribbon Parachute Canopy in Steady Descent." AIAA Paper, September 1984. (AIAA 84-0794.)
5.121. U.S. Air Force. Recovery Systems for Missiles and Target Aircraft, by J. R. Downing, J. H. McClow, R. 0. Fredette, and H. V. Hawkins. Part I, I, and III. USAF, March 1954 to December 1958. (USAF Report TR-58-53.)
5.122. _____. Study of Parachute Performance and Design Parameters for High Dynamic Pressure Operation, by P. F Pederson. USAF, May 1964. (USAF Report FDL-TDR-64-66.)
5.123. _____. Study and Exploratory Freeflight Investigations of Deployable Aerodynamic Decelerators Operating at High Altitudes and High Mach Numbers, by W E. Nikel and W M. Gran. USAF, July 1964. (USAF Report FDL-TDR-64-35.)
5.124. U.S. Air Force. Supersonic Parachute Research, by R. Berndt. USAF, July 1966. (USAF Report ASD-TR-66-236.)
5.125. Arnold Engineering Development Center. Performance of Flexible Aerodynamic Decelerators at Mach Numbers From 1.5 to 6, by J. S. Deitering. AEDC, July 1963. (Report AEDC-TDR-63-119.)
5.126. _____. Aerodynamic Performance of Various Hyperflo and Hemisflo Parachutes at Mach Numbers From 1.8 to 3, by D. E. Beichenau. AEDC, March 1965. (Report AEDC-TR-65-57.)
5.127. _____. Wind Tunnel Investigations of Flexible Aerodynamic Decelerator Characteristics at Mach Numbers From 1.5 to 6, by J. S. Deitering. AEDC, June 1965. (Report AEDC-TR-65-110.)
5.128. U.S. Air Force. Transient Temperatures of Parachutes During Descent, by E. Eckert, et al. USAF, August 1957. (USAF Report WADC-TN 57-320.)
5.129. _____. Instantaneous Local Temperatures of Aerodynamic Decelerators; Part I, Methods of Prediction, by G. Engholm, et al. USAF, September 1960. (USAF Report WADC-TR-60-670.)
5.130. R. M. Nerem and D. W Henke. "Theoretical and Experimental Studies of Supersonic Turbulent Wakes and Parachute Performance." AIAA Paper, September 1968. (AIAA 68-947.)
5.131. R. M. Nerem and T W Brunner. "Initial Results on the Theoretical Prediction of Drag for a Trailing Decelerator at Supersonic Speeds." AIAA Paper, September 1970. (AIAA 70-1177.)
5.132. C. W, Peterson, D. E. Waye, L. R. Rollstein, and I. T Holt. "Design and Performance of a Parachute for Supersonic and Subsonic Recovery of an 800-lb Payload." AIAA Paper, October 1986. (AIAA 86-2435-CP.)
5.133. X. Lin. "The Gun-Launched Tests for Supersonic Parachutes." AIAA Paper, October 1986. (AIAA 86-2474-CP)
5.134. W B. Pepper, R. J. Buffington, and C. W Peterson. "Exploratory Testing of Supersonic Ribbon Parachutes in the NASA 9-Ft by 7-Ft Wind Tunnel." AIAA Paper, October 1986. (AIAA 86-2446.)
5.135. U.S. Air Force. Investigation for Determining the Feasibility of Using Inflatable Balloon Type Drag Devices for Recovery Applications in the Transonic, Supersonic and Hypersonic Flight Regime; Part II, Mach 4 to 10 Feasibility Investigation, by the Goodyear Corp. USAF, December 1962. (USAF Report ASD-TDR-62-702.)
5.136. W R. Pinnell and F. Blotacher. "Correlation of Analytical and Empirical Techniques for Designing Supersonic and Hypersonic Decelerators." Proceedings of the 1966 AIAA Conference, Houston, Tex., September 1966.
5.137. A. C. Aebisher and E. S. Sutters. "Development Status of Ballute System for Stabilization and Retardation of Aircraft Stores." AIAA Paper, September 1970. (AIAA 70-1200.)
5.138. M. M. Mikulas and H. L. Bohan. "Summary of the Development Status of Attached Inflatable Decelerators." Proceedings of the 1968 Aerodynamic Deceleration Systems Conference, El Centro, Calif., September 1968.
5.139. H. L. Bohan and R. Miserentino. 'Attached Inflatable Decelerator Performance Evaluation and Application Study." AIAA Paper, September 1970. (AIAA 70-1163.)
5.140. T. T. Blanco, et al. "Recovery of High-Performance Reentry Vehicles." Proceedings of the 1966 AIAA Conference, Houston, Tex., September 1966.
5.141. Naval Weapons Center. A Look at the Hoffman Triangle Parachute-The First Successful Gliding Parachute, by D. Gold. NWC, China Lake, Calif.. 1982. (Aerosystems Department publication.)
5.142. Naval Aerospace Recovery Facility. Performance Evaluation, 35-Foot Diameter Extended Skirt Personnel Parachute Canopy Assembly With 'TU' Orifice, by G. L. Menard. NARC. El Centro, Calif., April 1967. (NARC Report 8-66, AD815808L.)
5.143. W J. Everett. "The Design and Development of the Parasail Parachute." Paper presented at the University of Minnesota Course on Aerodynamic Deceleration, July 1965.
5.144. E. D. Vickers. 'Aerodynamics of the Parasail (Paracommander)." Paper presented at the University of Minnesota Course on Aerodynamic Deceleration, July 1965.
5.145. Naval Aerospace Recovery Facility. Performance Investigation of Various Configurations of Personnel Maneuverable Parachute Canopy Assemblies, by G. L. Menard. NARC, El Centro, Calif., February 1971. (NARC Report 5-71.)
5.146. U.S. Air Force. Investigation of Various Textile Parachutes and Control Systems to Achieve Steerability, Parts I to III, by E. M. Linhart, V. E Riley, and C. R. Graham, Northrop Corp. USAF, January 1964. (USAF Report FDL-TDR-64-81.)
5.147. Northrop Corp. Development of a Large Controllable Parachute, 56-Ft Diameter Cloverleaf, by E. M. Linhart and C. R. Graham. Northrop Corp., Ventura Division, March 1967. (Northrop Report NVR-5064.)
5.148. E Rogallo. "Flexible Wings." AIAA Astronautics and Aeronautics, August 1968.
5.149. U.S. Air Force. Status of Research on Parawing Lifting Decelerators, by W C. Sleeman and T G. Gainer, NASA, Langley. Proceedings of the 1968 Aerodynamic Deceleration Systems Conference, El Centro, Calif., September 1968. (USAF Report FTC-TR-69-11.)
5.150. J. H. Moeller and E. M. Linhart. "Parawing Technology for Spacecraft Land Landing, a Progress Report." AIAA Paper, September 1970. (AIAA 71-1187.)
5.151. National Aeronautics and Space Administration. Free-Flight Investigation of Large All-Flexible Parawings and Performance Comparison with Small Parawings, by J. H. Moeller. NASA. March 1970. (NASA CR 66918.)
5.152. C. D. Jalbert. "Multi-Cell Wing Type Aerial Device." U.S. Patent No. 3,285,546 granted 15 November 1966.
5.153. U.S. Air Force. A Review of Parafoil Programs, by J. D. Nicolaides, R. J. Speelman. and G. L. Menard. Proceedings of the 1968 Aerodynamic Deceleration Systems Conference, El Centro, Calif., September 1968. (USAF Report FTC-TR-69-11.)
5.154. Royal Aircraft Establishment. The Performance and Design of Ram-Air Gliding Parachutes, by J. S. Lingard. RAE, Farnborough, England, August 1981. (Technical Report 81103.)
5.155. J. S. Lingard. "The Aerodynamics of Gliding Parachutes." AIAA Paper, October 1986. (AIAA 86-2427.)
5.156. National Aeronautics and Space Administration. Wind Tunnel Investigation of Ram-Air Inflated All-Flexible Wings of Aspect Ratios 1.0 to 3.0, by G. W Ware. NASA, 1969. (NASA Report TM SX-4187.)
5.157. Naval Aerospace Recovery Facility. Performance Evaluation Tests, Parafoil Maneuverable Personnel Parachute Assembly, Final Report, by G. L. Menard. NARC, El Centro, Calif., September 1969. (NARC Report 2-69.)
5.158. U. S. Air Force. Parafoil Steerable Parachute, Exploratory Development for Air Drop System Application, by R. J. Speelman, C. A. Babish, and R. J. Berndt. USAF (USAF Report AFFDL-TR-71-37.)
5.159. Naval Weapons Center. Basic Performance, Design, and Construction of Ram-Air Inflated Gliding Parachute Wings, by M. C. Butler. NWC, China Lake, Calif. (NWC TM 5739.)
5.160. R. J. Speelman, C. Bradshaw, J. Sobczak, and G. L. Menard. "Hi-Glide Personnel Canopies: Effort Toward Identification of Requirements." AIAA Paper. (AlAA 70-1194.)
5.161. Naval Weapons Center. In-Flight Ejection Seat Test Using the Aircrew Gliding Escape System (AGES) Parachute, by M. C. Butler, Jr. NWC, China Lake, Calif., September 1986, (NWC "IT' 6741.)
5.162. National Aeronautics and Space Administration. Wind Tunnel Investigation of the Static Aerodynamic Characteristics of a Multilobe Gliding Parachute (Sailwing), by G. W Ware and C. E. Libbey. NASA. (NASA T1chnical Note TND-4672.)
5.163. D. B. Goodrich. "Theoretical Study of the Longitudinal Stability of High-Performance Gliding Airdrop Systems." AIAA Paper. (AIAA 75-1394.)
5.164. W D. Brown. Parachutes. Pub. by Sir Isaac Pitman & Sons, LTD, London, July 1948.
5.165. B. K. Baca. 'An Experimental Study of the Performance of Clustered Parachutes in a Low-Speed Wind Tunnel." AIAA Paper, April 1984. (AIAA 84-0822.)
5.166. U.S. Air Force. Extraction Parachute Clustering Techniques, by C. W Marshall. USAF, October 1958. (USAF Report FTC-TN-58-18.)
5.167. _____. G-12B 64-Ft Cargo Parachute Cluster Tests, by C. W Marshall. USAF, March 1958. (USAF Report FTC-LR-58-102.)
5.168. _____.G-11, A Parachute Retardation System, by I. Svoboda. USAF, February 1961. (USAF Report FTC-TN-61-102.)
5.169. W C. Buhler. "Development of a High Performance Ringsail Parachute Cluster." AIAA Paper, May 1973. (AIAA 73-468.)
5.170. Pioneer Parachute Co. B-i Crew Module, Parachute Recovery System Qualification Tests, by W C. Buhler. BBC, April 1974. (Document 1155.)
5.171. E. D. Vickery and M. Eldredge. "Development of a System of Six Clustered 137-Ft Diameter Parachutes to Recover 60,000 Pounds." AIAA Paper, October 1986. (AIAA 86-2445-CE)
5.172. D. F. Wolf and H. R. Spahr. 'A Parachute Cluster Dynamic Analysis." AIAA Paper, November 1975. (AIAA 75-1398.)
5.173. U.S. Air Force. Drag and Dynamics of Single and Clustered Parachutes in Freestream and With Wake and Ground Effects, by H. G. Heinrich and R. A. Norem. USAF, November 1966. (USAF Report AFFDL-TR-66-104.)
5.174. H. G. Heinrich and J. C. Schmitt. "Measurement of Aerodynamic Coefficients of Twin Parachute Clusters." AIAA Paper, March 1979. (AIAA 79-0461.)
5.175. J. W Stone. "The Performance of Large Cluster Parachutes." Paper presented at the University of Minnesota Course on Aerodynamic Deceleration, July 1965.
5.176. U.S. Air Force. Wind Tunnel Study of Parachute Clustering, by J. E Braun. USAF, April 1963. (USAF Report ASD-TRD-63-159.)
5.177. J. H. Moeller. 'A Method of Load Prediction for Parachutes in Clusters," Journal of Aircraft, Vol. 4, No. 4, July-August 1967. Pp. 339-342.
5.178. U.S. Air Force. Investigation of the Flow Field During the Inflation of Clustered Parachutes, by R. J. Niccum and N. D. Kovacevic. USAF, November 1966. (USAF Report AFFDL-TR-66-106.)
5.179. D. J. Kolega, W D. Woodis, and J. D. Reuter. "Vent Modification of Large Ribbon Parachutes to Enhance Cluster Performance." AIAA Paper, October 1986. (AIAA 86-2433.)


![{\displaystyle t_{f_{2}}={\frac {n\ D_{o}}{v_{r}}}[{\frac {(C_{D}S)_{o}-(C_{D}S)_{R}}{(C_{D}S)_{o}}}]^{1/2}}](https://wikimedia.org/api/rest_v1/media/math/render/svg/160b23e194df6cfe11e2c7ab15f13ca2da562ee4)


